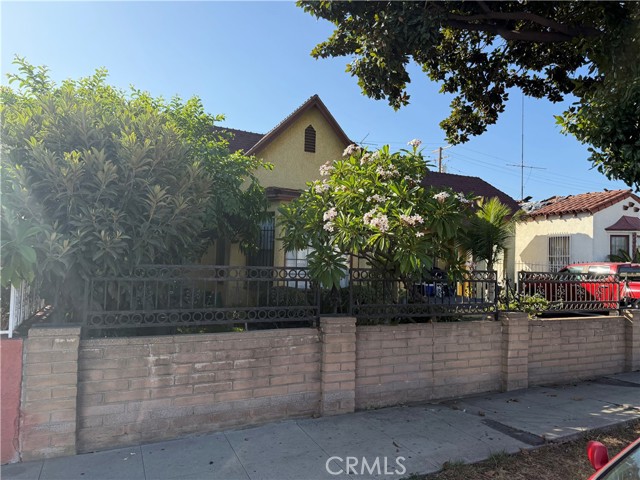
955 South HILLVIEW, East Los Angeles, CA 90022
955 South HILLVIEW, East Los Angeles, CA 90022
Property Description
LOCATION LOCATION LOCATION, CONVENIENTLY LOCATED IN THE HEART OF EAST LOS ANGELES. WALKING DISTANCE TO SHOPPING, TRANSPORTATION, SCHOOLS AND MANY OTHER AMENITIES. PROPERTY HAS POTENTIAL FOR ADDITIONAL INCOME. GOOD SQUARE FOOTAGE ON THIS BEAUTIFUL CENTRALLY LOCATED HOME.
Features & Amenities
Property Details
Mortgage Calculator
Current Rates
Comparative Market Analysis
Residential Tier · 5 active · 5 closed
East Los Angeles · Single Family Residence
Listed 3.8% below the median closed sale of $753,750. Price per sqft ($441) is a 13% discount to closed comps ($507). Closed comps sold at 100% of list — strong seller's market. Expect a longer timeline — comps averaged 168 days on market.
Price Position
Aligned with the market — fair pricing for the comps.
Active Properties (5)
Active Comparables
| Address | City | Year | BD | BTH | SqFt | LotSz | LP/SqFt | LP | DIM | Score |
|---|---|---|---|---|---|---|---|---|---|---|
| 709 Fraser Avenue | Los Angeles | 1925 | 3 | 2 | 1,230 | 4,498 | $610 | $750,000 | 20 | 90 |
| 668 Clela | Los Angeles | 1924 | 3 | 2 | 1,192 | 4,811 | $612 | $730,000 | 78 | 89 |
| 520 Williamson Avenue | Los Angeles | 1932 | 4 | 2 | 1,500 | 5,511 | $533 | $799,000 | 10 | 88 |
| 399 Amalia | East Los Angeles | 1926 | 5 | 2 | 1,576 | 5,302 | $498 | $785,000 | 30 | 88 |
| 5573 Pueblo Court | Commerce | 1980 | 3 | 3 | 1,528 | 5,450 | $543 | $830,000 | 75 | 82 |
| Total: 5 · Average | 3.6 | 2.2 | 1,405.2 | 5,114.4 | $559.2 | $778,800 | 42.6 | |||
| Median | 1,500 | $785,000 | ||||||||
Closed Properties (5)
Closed Comparables
| Address | City | Year | Date | BD | BTH | SqFt | LotSz | LP | SP | SP/SqFt | SP/LP | DIM | Score |
|---|---|---|---|---|---|---|---|---|---|---|---|---|---|
| 742 Belden Avenue | Los Angeles | 1927 | 08/27/2026 | 4 | 2 | 1,295 | 6,640 | $700,000 | $700,000 | $541 | 1.00 | 365 | 86 |
| 407 Vancouver Avenue | Los Angeles | 1927 | 09/18/2026 | 4 | 2 | 1,328 | 4,800 | $645,500 | $680,000 | $512 | 1.05 | 122 | 86 |
| 601 Keenan Ave | East Los Angeles | 1928 | 01/17/2026 | 3 | 2 | 1,263 | 5,387 | $810,000 | $810,000 | $641 | 1.00 | 125 | 82 |
| 6114 Allston Street | Los Angeles | 1928 | 12/30/2025 | 3 | 1 | 1,593 | 3,856 | $799,999 | $753,750 | $473 | 0.94 | 85 | 81 |
| 654 Oakford | Los Angeles | 1928 | 04/29/2026 | 5 | 3 | 2,189 | 5,169 | $799,999 | $806,000 | $368 | 1.01 | 145 | 80 |
| Total: 5 · Average | 3.8 | 2.0 | 1,533.6 | 5,170.4 | $749,950 | $749,950 | $507 | — | 168.4 | ||||
| Median | 1,328 | $753,750 | $753,750 | ||||||||||
Market Analysis
List vs Sale $/SqFt
Sale Price Trend
Days on Market
Sale vs List Price
This analysis was generated automatically from MLS data. For an in-depth, human-reviewed valuation, contact Joseph Sardella at josephsardella@gmail.com.