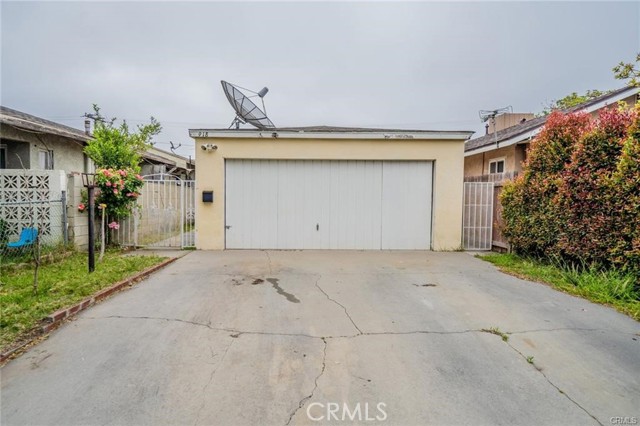
918 South Oak Street, Inglewood, CA 90301
918 South Oak Street, Inglewood, CA 90301
Property Description
Owner has reduced the price! This charming investment property is back on the market and offers incredible potential for rental income—perfect for first-time buyers or investors looking to take advantage of a rapidly growing area! Located in a vibrant, up-and-coming Inglewood neighborhood, this home sits just minutes from LAX, SoFi Stadium, and other major venues, making it highly desirable for future renters. The property features a beautifully lush landscape with mature trees providing generous shade throughout. Don’t miss this fantastic opportunity to own in a prime location where rental income can help offset mortgage payments and deliver long-term value!
Features & Amenities
Property Details
Mortgage Calculator
Current Rates
Comparative Market Analysis
Affordable Tier · 5 active · 5 closed
Inglewood · Single Family Residence
Listed 8.9% above the median closed sale of $730,000. Closed comps sold at 95% of list — buyers have negotiating leverage.
Price Position
Positioned above the market — commands a premium.
Active Properties (5)
Active Comparables
| Address | City | Year | BD | BTH | SqFt | LotSz | LP/SqFt | LP | DIM | Score |
|---|---|---|---|---|---|---|---|---|---|---|
| 301 Buckthorn | Inglewood | 1968 | 3 | 2 | 1,800 | 4,452 | $444 | $799,000 | 11 | 77 |
| 1135 Larch | Inglewood | 1922 | 2 | 1 | 1,188 | 3,474 | $572 | $680,000 | 19 | 75 |
| 4921 W 104Th St | Inglewood | 1948 | 3 | 2 | 836 | 6,298 | $952 | $795,900 | 148 | 73 |
| 444 Buckthorn | Inglewood | 1925 | 2 | 1 | 816 | 4,469 | $980 | $799,900 | 177 | 73 |
| 4922 104th Street | Inglewood | 2003 | 3 | 3 | 1,603 | 6,081 | $483 | $775,000 | 95 | 69 |
| Total: 5 · Average | 2.6 | 1.8 | 1,248.6 | 4,954.8 | $686.2 | $769,960 | 90 | |||
| Median | 1,188 | $795,900 | ||||||||
Closed Properties (5)
Closed Comparables
| Address | City | Year | Date | BD | BTH | SqFt | LotSz | LP | SP | SP/SqFt | SP/LP | DIM | Score |
|---|---|---|---|---|---|---|---|---|---|---|---|---|---|
| 956 Oak | Inglewood | 1949 | 07/01/2026 | 2 | 2 | 1,035 | 4,688 | $735,000 | $760,000 | $734 | 1.03 | 55 | 80 |
| 425 Elm | Inglewood | 1941 | 04/21/2026 | 3 | 2 | 1,112 | 4,554 | $1.05M | $872,000 | $784 | 0.83 | 75 | 79 |
| 522 Hillcrest Boulevard | Inglewood | 1924 | 07/01/2026 | 3 | 2 | 954 | 5,016 | $735,000 | $700,000 | $734 | 0.95 | 75 | 79 |
| 205 Hardy Street | Inglewood | 1927 | 09/24/2026 | 2 | 2 | 1,539 | 5,146 | $799,900 | $730,000 | $474 | 0.91 | 103 | 78 |
| 524 Magnolia Avenue | Inglewood | 1929 | 06/01/2026 | 2 | 1 | 1,124 | 4,845 | $725,000 | $725,000 | $645 | 1.00 | 118 | 74 |
| Total: 5 · Average | 2.4 | 1.8 | 1,152.8 | 4,849.8 | $757,400 | $757,400 | $674.2 | — | 85.2 | ||||
| Median | 1,112 | $730,000 | $730,000 | ||||||||||
Market Analysis
List vs Sale $/SqFt
Sale Price Trend
Days on Market
Sale vs List Price
This analysis was generated automatically from MLS data. For an in-depth, human-reviewed valuation, contact Joseph Sardella at josephsardella@gmail.com.