917 1St St, Rodeo, CA
917 1St St, Rodeo, CA
Property Description
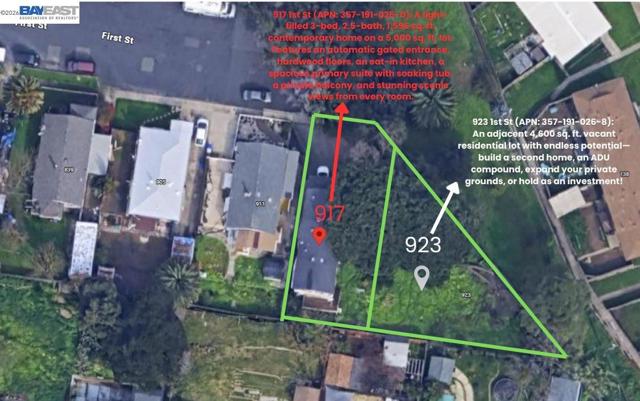
One Price, Two Parcels! Unbelievable bay-view hilltop package offering a move-in ready home AND the adjacent buildable lot (Total ~9,600 SF land across 2 APNs). 917 1st St: Gated 3 BD / 2.5 BA (1,596 SF on 5,000 SF lot) contemporary 2-story home filled with natural light, hardwood floors, an eat-in kitchen, panoramic area views from every room, and a primary suite with tub. 923 1st St: Separate 4,600 SF vacant residential lot with immense potential to build an additional home, create a multi-gen estate, or add an ADU. Minutes to San Pablo Bay—an extraordinary investment opportunity!
Features & Amenities
Property Details
Mortgage Calculator
Current Rates
Comparative Market Analysis
Residential Tier · 5 active · 5 closed
Rodeo · Single Family Residence
Listed in line with the median closed sale of $740,000. Closed comps sold at 101% of list — strong seller's market.
Price Position
Aligned with the market — fair pricing for the comps.
Active Properties (5)
Active Comparables
| Address | City | Year | BD | BTH | SqFt | LotSz | LP/SqFt | LP | DIM | Score |
|---|---|---|---|---|---|---|---|---|---|---|
| 104 Bridgeview Ct | Crockett | 1992 | 3 | 3 | 1,779 | 3,600 | $359 | $638,500 | 12 | 62 |
| 118 Cottonwood Ct | Hercules | 1978 | 3 | 2 | 1,583 | 5,600 | $515 | $815,000 | 81 | 58 |
| 200 Oriole Ct | Hercules | 1981 | 4 | 3 | 1,905 | 6,615 | $407 | $775,000 | 31 | 57 |
| 1020 Sandpoint Dr | Rodeo | 1977 | 3 | 2 | 1,078 | 14,175 | $673 | $725,000 | 9 | 56 |
| 133 Meadowlark Way | Hercules | 1986 | 3 | 2 | 1,555 | 9,453 | $449 | $698,000 | 16 | 54 |
| Total: 5 · Average | 3.2 | 2.4 | 1,580 | 7,888.6 | $480.6 | $730,300 | 29.8 | |||
| Median | 1,583 | $725,000 | ||||||||
Closed Properties (5)
Closed Comparables
| Address | City | Year | Date | BD | BTH | SqFt | LotSz | LP | SP | SP/SqFt | SP/LP | DIM | Score |
|---|---|---|---|---|---|---|---|---|---|---|---|---|---|
| 111 Garretson Ave | Rodeo | 1912 | 08/14/2026 | 4 | 3 | 1,412 | 3,049 | $650,000 | $650,000 | $460 | 1.00 | 31 | 74 |
| 913 Seascape Cir | Rodeo | 1975 | 08/28/2026 | 4 | 2 | 1,618 | 7,000 | $780,000 | $780,000 | $482 | 1.00 | 45 | 69 |
| 158 Bedford | Hercules | 1986 | 05/05/2026 | 3 | 2 | 1,422 | 6,136 | $724,888 | $740,000 | $520 | 1.02 | 25 | 68 |
| 858 Coral Ridge Circle | Rodeo | 1979 | 09/09/2026 | 4 | 3 | 1,977 | 5,684 | $785,000 | $815,000 | $412 | 1.04 | 46 | 67 |
| 797 Coral Ridge Cir | Rodeo | 1979 | 04/07/2026 | 4 | 2 | 1,405 | 4,370 | $700,000 | $690,000 | $491 | 0.99 | 45 | 67 |
| Total: 5 · Average | 3.8 | 2.4 | 1,566.8 | 5,247.8 | $735,000 | $735,000 | $473 | — | 38.4 | ||||
| Median | 1,422 | $740,000 | $740,000 | ||||||||||
Market Analysis
List vs Sale $/SqFt
Sale Price Trend
Days on Market
Sale vs List Price
This analysis was generated automatically from MLS data. For an in-depth, human-reviewed valuation, contact Joseph Sardella at josephsardella@gmail.com.