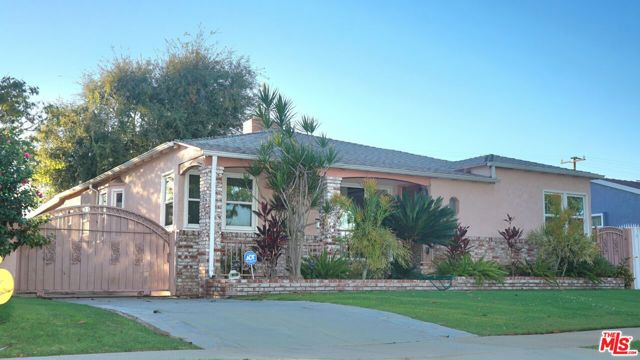
9133 South 7th Avenue, Inglewood, CA 90305
9133 South 7th Avenue, Inglewood, CA 90305
Property Description
This Beautifully Maintained home is a 1,430 square foot house on a 8,507 square foot lot with 3 bedrooms and 2 bathrooms. Large rooms throughout the house and lovely landscaping front and back. Located in the Awesome Morningside Park Inglewood Neighborhood near SoFi Stadium, Hollywood Park Casino and the Forum. This home is located on a well sun lite quiet street. this is a Gem of a property that won't last.
Features & Amenities
Property Details
Mortgage Calculator
Current Rates
Comparative Market Analysis
Affordable Tier · 5 active · 5 closed
Inglewood · Single Family Residence
Listed 11.1% above the median closed sale of $810,000. Price per sqft ($629) is a 11% premium to closed comps ($565). Closed comps sold at 101% of list — strong seller's market.
Price Position
Positioned above the market — commands a premium.
Active Properties (5)
Active Comparables
| Address | City | Year | BD | BTH | SqFt | LotSz | LP/SqFt | LP | DIM | Score |
|---|---|---|---|---|---|---|---|---|---|---|
| 8823 Wilton Place | Los Angeles | 1938 | 3 | 2 | 1,521 | 5,439 | $526 | $799,999 | 76 | 86 |
| 8905 Ruthelen | Los Angeles | 1938 | 3 | 2 | 1,430 | 5,402 | $559 | $800,000 | 17 | 84 |
| 2036 95th Street | Los Angeles | 1944 | 3 | 2 | 1,215 | 5,101 | $653 | $794,000 | 13 | 84 |
| 8319 Van Ness Avenue | Inglewood | 1936 | 3 | 2 | 1,468 | 5,000 | $612 | $899,000 | 38 | 82 |
| 2416 80th | Inglewood | 1937 | 3 | 2 | 1,322 | 4,726 | $741 | $979,900 | 39 | 80 |
| Total: 5 · Average | 3.0 | 2.0 | 1,391.2 | 5,133.6 | $618.2 | $854,579.8 | 36.6 | |||
| Median | 1,430 | $800,000 | ||||||||
Closed Properties (5)
Closed Comparables
| Address | City | Year | Date | BD | BTH | SqFt | LotSz | LP | SP | SP/SqFt | SP/LP | DIM | Score |
|---|---|---|---|---|---|---|---|---|---|---|---|---|---|
| 9232 2nd Avenue | Inglewood | 1939 | 06/25/2026 | 3 | 2 | 1,725 | 8,508 | $790,000 | $790,000 | $458 | 1.00 | 92 | 86 |
| 2715 Hardy Street | Inglewood | 1948 | 10/02/2026 | 3 | 2 | 1,544 | 5,411 | $899,000 | $899,000 | $582 | 1.00 | 64 | 83 |
| 9619 11th Avenue | Inglewood | 1952 | 07/01/2026 | 3 | 2 | 1,606 | 7,162 | $849,999 | $865,000 | $539 | 1.02 | 50 | 83 |
| 9520 2nd Avenue | Inglewood | 1944 | 05/04/2026 | 2 | 2 | 1,650 | 8,515 | $835,000 | $810,000 | $491 | 0.97 | 31 | 81 |
| 9400 4th Avenue | Inglewood | 1940 | 03/20/2026 | 2 | 2 | 1,058 | 8,515 | $749,950 | $800,000 | $756 | 1.07 | 66 | 80 |
| Total: 5 · Average | 2.6 | 2.0 | 1,516.6 | 7,622.2 | $832,800 | $832,800 | $565.2 | — | 60.6 | ||||
| Median | 1,606 | $810,000 | $810,000 | ||||||||||
Market Analysis
List vs Sale $/SqFt
Sale Price Trend
Days on Market
Sale vs List Price
This analysis was generated automatically from MLS data. For an in-depth, human-reviewed valuation, contact Joseph Sardella at josephsardella@gmail.com.