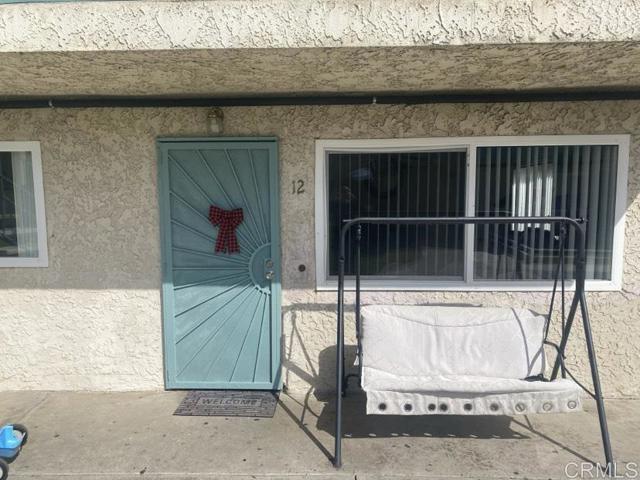
1 / 8
908 South Sunshine Avenue, 12, El Cajon, CA 92020
$400K2bd · 2ba · 850 sqft
Lot 1 sqft•HOA $275/mo•Condominium•Active•209d on market•MLS# 8P-2602562
908 South Sunshine Avenue, 12, El Cajon, CA 92020
MLS# 8P-2602562•Residential•Condominium
Active209 days on market
$400,000
2
Beds
2
Baths
850
Sq Ft
1
Lot Sq Ft
$275
HOA/mo
1990
Year Built
See Remarks
View
Property Description
Charming lower-level condo in the heart of El Cajon! This spacious 2-bed, 2-bath home features in-unit laundry and a private primary suite. Conveniently located near schools, shopping, and dining, perfect for comfortable and easy living. Must see!!!
Features & Amenities
FeeBuilt 1990
Property Details
Land Type
Fee
Year Built
1990
Property Type
Residential
Property Subtype
Condominium
Parking Spaces
1
Garage Spaces
0
Cooling
Central Air
View
See Remarks
City
El Cajon
Zip Code
92020
County
San Diego
Mortgage Calculator
Current Rates
$
$
%
Monthly Payment
$2,022.62
Principal & Interest
Loan Amount
$320,000
Total Interest
$408,142
Total Payment Over 30 Years
$728,142
This calculator provides estimates only. Actual mortgage payments may include taxes, insurance, HOA fees, and PMI. Contact a lender for accurate quotes.
Comparative Market Analysis
Affordable Tier · 5 active · 5 closed
908 South Sunshine Avenue, 12, El Cajon, CA 92020
El Cajon · Condominium
$400K
Affordable TierBeds
2
Baths
2
Sqft
850
Lot
34,412 sqft
Year
1990
$/Sqft
$471
Pool: No✓
Spa: No✓
View: See Remarks✓
Listed in line with the median closed sale of $395,000.
Price Position
Aligned with the market — fair pricing for the comps.
At market
Subject listed at $400K· $471/sqft
Total list price
Closed comps
vs closed median $395K
+$5K (+1.3%)
Active comps
vs active median $380K
+$20K (+5.3%)
Price per sqft
Closed compsinsufficient comp data
Active comps
vs active avg $/sqft $450
+$21 (+4.8%)
Active Properties (5)
Active Comparables
| Address | City | Year | BD | BTH | SqFt | LotSz | LP/SqFt | LP | DIM | Score |
|---|---|---|---|---|---|---|---|---|---|---|
| 908 Sunshine Avenue | El Cajon | 1990 | 2 | 2 | 850 | 34,412 | $471 | $400,000 | 208 | 96 |
| 1025 Estes Street | El Cajon | 1985 | 2 | 2 | 940 | 33,977 | $453 | $425,951 | 73 | 94 |
| 1000 Estes St | El Cajon | 1981 | 2 | 2 | 960 | 0 | $396 | $380,000 | 10 | 91 |
| 792 Avocado Avenue | El Cajon | 1990 | 2 | 1 | 789 | 133,294 | $482 | $380,000 | 53 | 86 |
| 732 Lexington Avenue | El Cajon | 1978 | 1 | 1 | 785 | 1 | $446 | $350,000 | 88 | 76 |
| Total: 5 · Average | 1.8 | 1.6 | 864.8 | 50,421 | $449.6 | $387,190.2 | 86.4 | |||
| Median | 850 | $380,000 | ||||||||
Closed Properties (5)
Closed Comparables
| Address | City | Year | Date | BD | BTH | SqFt | LotSz | LP | SP | SP/SqFt | SP/LP | DIM | Score |
|---|---|---|---|---|---|---|---|---|---|---|---|---|---|
| 1000 Estes Street | El Cajon | 1981 | 09/24/2026 | 2 | 2 | 860 | 0 | $385,000 | $382,500 | $445 | 0.99 | 103 | 95 |
| 1000 Estes St | El Cajon | 1981 | 07/24/2026 | 2 | 2 | 960 | 120,661 | $395,000 | $395,000 | $411 | 1.00 | 128 | 87 |
| 1000 Estes Street | El Cajon | 1981 | 06/02/2026 | 2 | 2 | 960 | 120,661 | $399,999 | $370,000 | $385 | 0.93 | 125 | 86 |
| 188 Lincoln Avenue | El Cajon | 1985 | 12/16/2025 | 2 | 2 | 805 | 0 | $399,000 | $411,000 | $511 | 1.03 | 202 | 82 |
| 180 Chambers Street | El Cajon | 1985 | 05/19/2026 | 2 | 2 | 925 | 3 | $439,900 | $445,000 | $481 | 1.01 | 33 | 82 |
| Total: 5 · Average | 2.0 | 2.0 | 902 | 80,441.667 | $400,700 | $400,700 | $446.6 | — | 118.2 | ||||
| Median | 925 | $395,000 | $395,000 | ||||||||||
Market Analysis
List vs Sale $/SqFt
Sale Price Trend
Days on Market
Sale vs List Price
AI-generated CMA
This analysis was generated automatically from MLS data. For an in-depth, human-reviewed valuation, contact Joseph Sardella at josephsardella@gmail.com.