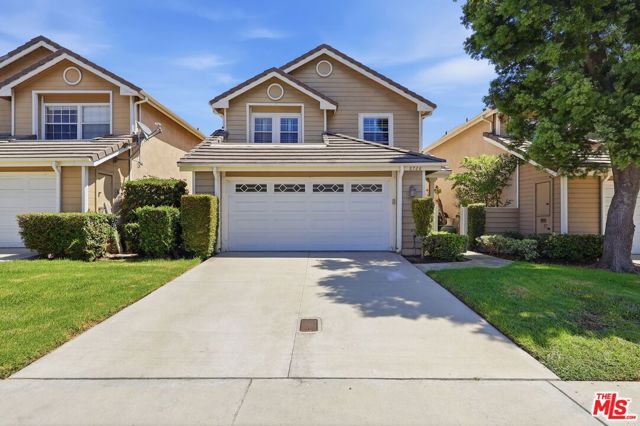
8728 Dartford Place, Inglewood, CA 90305
8728 Dartford Place, Inglewood, CA 90305
Property Description
A rare opportunity to own a beautifully updated 3-bedroom, 3-bathroom residence in the highly sought-after Carlton Square community.This exceptional home offers a wonderful combination of comfort, style, and privacy. Thoughtfully updated throughout, the residence features inviting living spaces and a beautifully maintained setting designed for both everyday living and entertaining.One of the standout features is the amazing landscaping surrounding the property, creating a lush, private atmosphere and enhancing the home's curb appeal.Residents of Carlton Square also enjoy an impressive selection of community amenities, including a resort-style swimming pool, tennis courts, clubhouse, dog park, and gated security.With its desirable location, beautifully updated interior, exceptional landscaping, and outstanding amenities, this is a rare Carlton Square property that should not be missed.
Features & Amenities
Property Details
Mortgage Calculator
Current Rates
Comparative Market Analysis
Residential Tier · 5 active · 5 closed
Inglewood · Single Family Residence
Listed 3.0% below the median closed sale of $865,000.
Price Position
Aligned with the market — fair pricing for the comps.
Active Properties (5)
Active Comparables
| Address | City | Year | BD | BTH | SqFt | LotSz | LP/SqFt | LP | DIM | Score |
|---|---|---|---|---|---|---|---|---|---|---|
| 8708 EDMONTON PLACE | Inglewood | 1986 | 3 | 3 | 1,722 | 126,525 | $494 | $850,000 | 179 | 72 |
| 9133 7th Avenue | Inglewood | 1939 | 3 | 2 | 1,430 | 8,507 | $629 | $900,000 | 14 | 71 |
| 301 Buckthorn | Inglewood | 1968 | 3 | 2 | 1,800 | 4,452 | $444 | $799,000 | 11 | 69 |
| 2132 77th Street | Los Angeles | 1941 | 3 | 2 | 1,618 | 6,708 | $479 | $775,000 | 12 | 65 |
| 3513 78th Street | Inglewood | 1939 | 3 | 2 | 1,495 | 6,585 | $522 | $780,000 | 145 | 64 |
| Total: 5 · Average | 3.0 | 2.2 | 1,613 | 30,555.4 | $513.6 | $820,800 | 72.2 | |||
| Median | 1,618 | $799,000 | ||||||||
Closed Properties (5)
Closed Comparables
| Address | City | Year | Date | BD | BTH | SqFt | LotSz | LP | SP | SP/SqFt | SP/LP | DIM | Score |
|---|---|---|---|---|---|---|---|---|---|---|---|---|---|
| 3616 Kensley Drive | Inglewood | 1986 | 05/08/2026 | 3 | 3 | 1,722 | 52,200 | $899,999 | $890,000 | $517 | 0.99 | 53 | 85 |
| 7905 West Boulevard | Inglewood | 1939 | 07/31/2026 | 3 | 2 | 1,620 | 5,880 | $849,000 | $830,000 | $512 | 0.98 | 35 | 72 |
| 655 Queen Street | Inglewood | 1925 | 10/06/2026 | 3 | 2 | 2,208 | 7,495 | $799,000 | $785,000 | $356 | 0.98 | 145 | 69 |
| 9619 11th Avenue | Inglewood | 1952 | 07/01/2026 | 3 | 2 | 1,606 | 7,162 | $849,999 | $865,000 | $539 | 1.02 | 50 | 65 |
| 2917 82nd Place | Inglewood | 1938 | 06/26/2026 | 3 | 2 | 1,582 | 6,251 | $895,000 | $904,000 | $571 | 1.01 | 56 | 65 |
| Total: 5 · Average | 3.0 | 2.2 | 1,747.6 | 15,797.6 | $854,800 | $854,800 | $499 | — | 67.8 | ||||
| Median | 1,620 | $865,000 | $865,000 | ||||||||||
Market Analysis
List vs Sale $/SqFt
Sale Price Trend
Days on Market
Sale vs List Price
This analysis was generated automatically from MLS data. For an in-depth, human-reviewed valuation, contact Joseph Sardella at josephsardella@gmail.com.