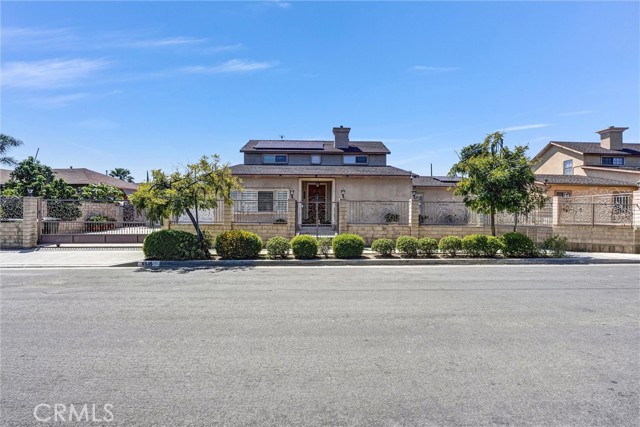
8535 Norris, Sun Valley, CA 91352
8535 Norris, Sun Valley, CA 91352
Property Description
Discover the perfect blend of space, comfort, and style in this impressive 2,464 sq. ft. two-story home. Thoughtfully designed for modern living, this spacious residence offers plenty of room for entertaining, relaxing, and creating lasting memories. With generous living areas, well-proportioned bedrooms, and the added flexibility of two levels, this home provides both functionality and privacy. Whether you're looking for more space for your family or a home to grow into, this property is an excellent opportunity to enjoy comfortable living in a beautiful setting. ADU plans all approved. PLEASE click 360 button under the map section above to see walk through video of the inside of the property
Features & Amenities
Property Details
Mortgage Calculator
Current Rates
Comparative Market Analysis
Residential Tier · 5 active · 5 closed
Sun Valley · Single Family Residence
Listed 14.2% above the median closed sale of $1,050,000.
Price Position
Positioned above the market — commands a premium.
Active Properties (5)
Active Comparables
| Address | City | Year | BD | BTH | SqFt | LotSz | LP/SqFt | LP | DIM | Score |
|---|---|---|---|---|---|---|---|---|---|---|
| 10957 Crockett | Sun Valley | 1953 | 5 | 4 | 1,880 | 8,021 | $638 | $1.20M | 4 | 82 |
| 10845 Vinedale Street | Sun Valley | 1940 | 6 | 4 | 2,364 | 7,349 | $508 | $1.20M | 200 | 77 |
| 11853 Cantara Street | Los Angeles | 1953 | 5 | 4 | 2,411 | 8,124 | $537 | $1.29M | 52 | 70 |
| 7558 Delia | Sun Valley | 1947 | 4 | 3 | 1,605 | 5,672 | $685 | $1.10M | 2 | 69 |
| 7822 Ferncola Avenue | Sun Valley | 1939 | 6 | 4 | 1,950 | 5,544 | $538 | $1.05M | 3 | 68 |
| Total: 5 · Average | 5.2 | 3.8 | 2,042 | 6,942 | $581.2 | $1.17M | 52.2 | |||
| Median | 1,950 | $1.20M | ||||||||
Closed Properties (5)
Closed Comparables
| Address | City | Year | Date | BD | BTH | SqFt | LotSz | LP | SP | SP/SqFt | SP/LP | DIM | Score |
|---|---|---|---|---|---|---|---|---|---|---|---|---|---|
| 10823 Cantara Street | Sun Valley | 1945 | 05/12/2026 | 5 | 4 | 2,349 | 6,423 | $999,000 | $1.02M | $436 | 1.03 | 41 | 79 |
| 10636 Nettleton Street | Sun Valley | 1954 | 07/29/2026 | 4 | 3 | 1,424 | 9,605 | $995,000 | $1.05M | $737 | 1.05 | 48 | 68 |
| 6051 Tujunga Avenue | North Hollywood | 2026 | 05/28/2026 | 4 | 5 | 2,818 | 1,418 | $1.15M | $1.13M | $401 | 0.98 | 99 | 68 |
| 7943 Ledge Avenue | Sun Valley | 1938 | 07/17/2026 | 3 | 3 | 2,122 | 10,195 | $1.10M | $1.05M | $495 | 0.95 | 107 | 66 |
| 10741 Stagg Street | Sun Valley | 1953 | 07/24/2026 | 5 | 3 | 3,160 | 14,252 | $1.18M | $1.07M | $340 | 0.92 | 71 | 63 |
| Total: 5 · Average | 4.2 | 3.6 | 2,374.6 | 8,378.6 | $1.07M | $1.07M | $481.8 | — | 73.2 | ||||
| Median | 2,349 | $1.05M | $1.05M | ||||||||||
Market Analysis
List vs Sale $/SqFt
Sale Price Trend
Days on Market
Sale vs List Price
This analysis was generated automatically from MLS data. For an in-depth, human-reviewed valuation, contact Joseph Sardella at josephsardella@gmail.com.