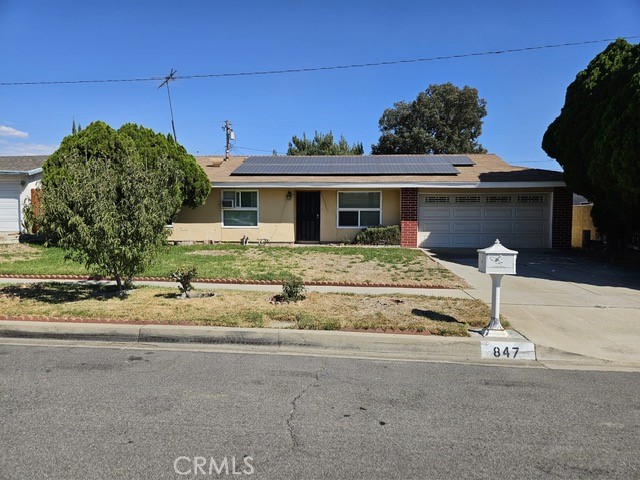
847 South Forest, Bloomington, CA 92316
847 South Forest, Bloomington, CA 92316
Property Description
Attention investors and cash buyers! Excellent investment opportunity with tremendous potential. If you’re looking to expand your real estate portfolio to fix and hold, consider this property. This property isn’t for those looking for a fix and flip. The property is sold as-is and will not qualify for traditional FHA or conventional financing due to its current condition. If you’re a home buyer looking for a fix and live option, check with your preferred lender about the FHA 203K. If sweat equity is an option, this could be the right property. The seller is a Trust and will not make repairs. Buyer to perform all due diligence and verify property condition, permits, and financing eligibility.
Features & Amenities
Property Details
Mortgage Calculator
Current Rates
Comparative Market Analysis
Affordable Tier · 5 active · 5 closed
Bloomington · Single Family Residence
Listed 8.3% below the median closed sale of $540,000. Price per sqft ($471) is a 10% discount to closed comps ($525).
Price Position
Priced below the market — value advantage over the field.
Active Properties (5)
Active Comparables
| Address | City | Year | BD | BTH | SqFt | LotSz | LP/SqFt | LP | DIM | Score |
|---|---|---|---|---|---|---|---|---|---|---|
| 18631 Hawthorne | Bloomington | 1955 | 3 | 2 | 1,173 | 8,500 | $451 | $529,000 | 22 | 87 |
| 9829 Williams | Bloomington | 1956 | 3 | 2 | 1,073 | 8,100 | $503 | $539,999 | 101 | 85 |
| 9730 Linden Avenue | Bloomington | 1991 | 3 | 2 | 1,215 | 7,200 | $453 | $549,900 | 46 | 84 |
| 8970 Williams | Fontana | 1954 | 2 | 1 | 878 | 8,450 | $558 | $489,990 | 31 | 81 |
| 9785 Vine | Bloomington | 1966 | 4 | 2 | 1,328 | 7,700 | $410 | $544,900 | 59 | 81 |
| Total: 5 · Average | 3.0 | 1.8 | 1,133.4 | 7,990 | $475 | $530,757.8 | 51.8 | |||
| Median | 1,173 | $539,999 | ||||||||
Closed Properties (5)
Closed Comparables
| Address | City | Year | Date | BD | BTH | SqFt | LotSz | LP | SP | SP/SqFt | SP/LP | DIM | Score |
|---|---|---|---|---|---|---|---|---|---|---|---|---|---|
| 1560 Athol Street | Bloomington | 1970 | 11/14/2025 | 3 | 2 | 1,060 | 7,475 | $540,000 | $540,000 | $509 | 1.00 | 58 | 92 |
| 9330 Westeria | Bloomington | 1985 | 08/20/2026 | 3 | 2 | 1,128 | 8,094 | $569,000 | $565,000 | $501 | 0.99 | 42 | 89 |
| 1510 Eureka | San Bernardino | 1951 | 07/20/2026 | 3 | 2 | 1,255 | 9,450 | $560,000 | $560,000 | $446 | 1.00 | 58 | 85 |
| 9416 Cedar | Bloomington | 1955 | 04/24/2026 | 3 | 1 | 1,043 | 7,400 | $529,000 | $529,000 | $507 | 1.00 | 97 | 84 |
| 18250 Bonnie | Fontana | 1963 | 10/15/2026 | 2 | 2 | 720 | 9,800 | $475,000 | $475,000 | $660 | 1.00 | 63 | 79 |
| Total: 5 · Average | 2.8 | 1.8 | 1,041.2 | 8,443.8 | $533,800 | $533,800 | $524.6 | — | 63.6 | ||||
| Median | 1,060 | $540,000 | $540,000 | ||||||||||
Market Analysis
List vs Sale $/SqFt
Sale Price Trend
Days on Market
Sale vs List Price
This analysis was generated automatically from MLS data. For an in-depth, human-reviewed valuation, contact Joseph Sardella at josephsardella@gmail.com.