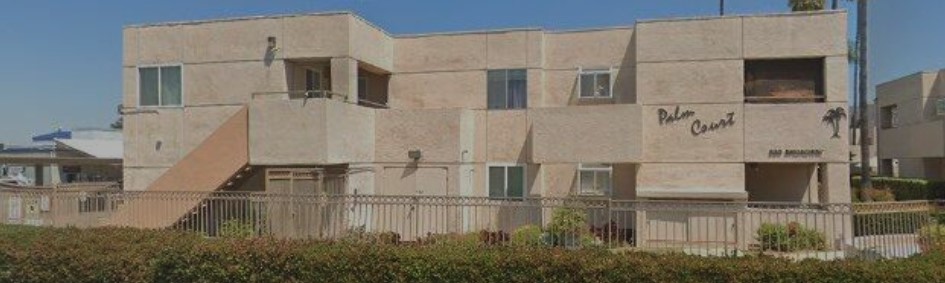
830 Broadway, 19, El Cajon, CA 92021
830 Broadway, 19, El Cajon, CA 92021
Property Description
Great opportunity to own a conveniently located property in the heart of El Cajon! This unit offers comfortable living with easy access to shopping, restaurants, schools, parks, and everyday amenities. Centrally located near downtown El Cajon, with convenient access to Interstate 8 and Highway 67 for commuting throughout San Diego County. Whether you're looking for a primary residence or an investment opportunity, this property offers excellent potential in an established community. Don't miss this opportunity!
Features & Amenities
Property Details
Mortgage Calculator
Current Rates
About El Cajon
This property is located in El Cajon, a community in El Cajon. Explore more listings in this neighborhood to compare options and pricing.
View El Cajon ListingsComparative Market Analysis
Affordable Tier · 5 active · 5 closed
El Cajon · El Cajon · Condominium
Listed 4.8% above the median closed sale of $415,000. Closed comps sold at 103% of list — strong seller's market.
Price Position
Aligned with the market — fair pricing for the comps.
Active Properties (5)
Active Comparables
| Address | City | Year | BD | BTH | SqFt | LotSz | LP/SqFt | LP | DIM | Score |
|---|---|---|---|---|---|---|---|---|---|---|
| 455 Ballantyne | El Cajon | 1987 | 2 | 2 | 925 | 163,395 | $432 | $399,900 | 79 | 86 |
| 1045 Peach Ave | El Cajon | 1985 | 2 | 2 | 1,100 | 0 | $364 | $399,900 | 75 | 78 |
| 888 Cherrywood Way | El Cajon | 1979 | 2 | 3 | 1,024 | 53,563 | $396 | $405,000 | 85 | 74 |
| 390 Madison | El Cajon | 1982 | 2 | 2 | 1,086 | 0 | $405 | $440,000 | 205 | 74 |
| 1263 Oakdale | El Cajon | 1965 | 3 | 2 | 1,280 | 5 | $391 | $499,900 | 19 | 72 |
| Total: 5 · Average | 2.2 | 2.2 | 1,083 | 72,321 | $397.6 | $428,940 | 92.6 | |||
| Median | 1,086 | $405,000 | ||||||||
Closed Properties (5)
Closed Comparables
| Address | City | Year | Date | BD | BTH | SqFt | LotSz | LP | SP | SP/SqFt | SP/LP | DIM | Score |
|---|---|---|---|---|---|---|---|---|---|---|---|---|---|
| 521 Mollison | El Cajon | 1981 | 04/17/2026 | 2 | 1 | 844 | 18,187 | $415,000 | $415,000 | $492 | 1.00 | 49 | 81 |
| 1045 Peach Avenue | El Cajon | 1985 | 09/30/2026 | 2 | 2 | 1,100 | 0 | $399,000 | $425,000 | $386 | 1.06 | 61 | 79 |
| 1045 Peach Ave | El Cajon | 1985 | 08/24/2026 | 2 | 2 | 1,100 | 0 | $459,000 | $459,000 | $417 | 1.00 | 25 | 78 |
| 888 Cherrywood Way | El Cajon | 1979 | 07/01/2026 | 2 | 2 | 1,024 | 53,579 | $399,000 | $399,000 | $390 | 1.00 | 47 | 76 |
| 505 Madison Avenue | El Cajon | 1987 | 06/16/2026 | 2 | 2 | 925 | 163,350 | $359,999 | $387,000 | $418 | 1.07 | 75 | 76 |
| Total: 5 · Average | 2.0 | 1.8 | 998.6 | 78,372 | $417,000 | $417,000 | $420.6 | — | 51.4 | ||||
| Median | 1,024 | $415,000 | $415,000 | ||||||||||
Market Analysis
List vs Sale $/SqFt
Sale Price Trend
Days on Market
Sale vs List Price
This analysis was generated automatically from MLS data. For an in-depth, human-reviewed valuation, contact Joseph Sardella at josephsardella@gmail.com.