812 Inglewood, Inglewood, CA 90302
812 Inglewood, Inglewood, CA 90302
Property Description
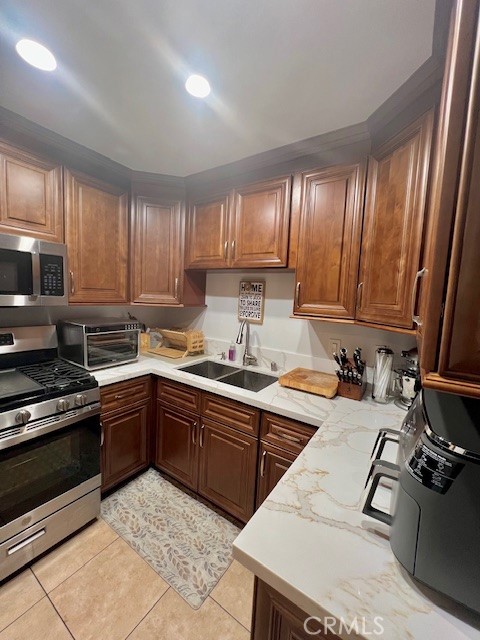
Exceptionally positioned within Los Angeles’ premier sports, tech, and entertainment corridor, this property offers unmatched proximity to world-class venues and major employer hubs: Entertainment & Sports: SoFi Stadium, Hollywood Park, Intuit Dome, and Kia Forum. Employment & Transit: LAX, major aerospace/tech headquarters, and direct access to the I-405 and I-10 freeways. Key Investment Highlights: High-Demand Dual-Primary Floor Plan: Features a rare layout with private suites on separate levels, ideal for co-living arrangements and maximized rental yield. Turnkey Condition: Fully renovated featuring vaulted architectural ceilings and new receding lighting, new cabinets and designer quartz kitchen finishes, and modern luxury bath updates—eliminating immediate capital expenditure needs. Efficient Operations: Includes an indoor laundry room, ample integrated garage storage, and an HOA structure that includes water service for lower operational overhead.
Features & Amenities
Property Details
Mortgage Calculator
Current Rates
Comparative Market Analysis
Affordable Tier · 5 active · 5 closed
Inglewood · Condominium
Listed in line with the median closed sale of $530,000. Price per sqft ($629) is a 27% premium to closed comps ($494).
Price Position
Aligned with the market — fair pricing for the comps.
Active Properties (5)
Active Comparables
| Address | City | Year | BD | BTH | SqFt | LotSz | LP/SqFt | LP | DIM | Score |
|---|---|---|---|---|---|---|---|---|---|---|
| 324 Plymouth Street | Inglewood | 1987 | 2 | 2 | 850 | 27,748 | $587 | $499,000 | 108 | 91 |
| 610 Venice | Inglewood | 1990 | 2 | 2 | 869 | 28,718 | $541 | $470,000 | 6 | 90 |
| 633 Hardin Drive | Inglewood | 1984 | 2 | 2 | 867 | 7,081 | $531 | $459,995 | 136 | 89 |
| 756 Inglewood | Inglewood | 1969 | 2 | 2 | 953 | 24,982 | $472 | $450,000 | 45 | 84 |
| 620 Hyde Park Boulevard | Inglewood | 1983 | 2 | 2 | 1,031 | 65,895 | $446 | $460,000 | 59 | 81 |
| Total: 5 · Average | 2.0 | 2.0 | 914 | 30,884.8 | $515.4 | $467,799 | 70.8 | |||
| Median | 869 | $460,000 | ||||||||
Closed Properties (5)
Closed Comparables
| Address | City | Year | Date | BD | BTH | SqFt | LotSz | LP | SP | SP/SqFt | SP/LP | DIM | Score |
|---|---|---|---|---|---|---|---|---|---|---|---|---|---|
| 822 Victor Avenue | Inglewood | 1981 | 10/07/2026 | 2 | 3 | 1,086 | 22,424 | $559,000 | $562,000 | $517 | 1.00 | 65 | 85 |
| 614 Venice Way | Inglewood | 1990 | 07/08/2026 | 2 | 2 | 1,019 | 0 | $449,000 | $449,000 | $441 | 1.00 | 34 | 85 |
| 856 Beach Avenue | Inglewood | 1989 | 08/19/2026 | 2 | 3 | 1,051 | 25,104 | $549,000 | $555,555 | $529 | 1.01 | 42 | 84 |
| 800 Glenway Drive | Inglewood | 1990 | 06/30/2026 | 2 | 3 | 1,034 | 0 | $545,000 | $530,000 | $513 | 0.97 | 81 | 82 |
| 907 Inglewood Avenue | Inglewood | 1987 | 06/29/2026 | 2 | 2 | 1,090 | 7,504 | $520,000 | $515,000 | $472 | 0.99 | 80 | 80 |
| Total: 5 · Average | 2.0 | 2.6 | 1,056 | 18,344 | $522,311 | $522,311 | $494.4 | — | 60.4 | ||||
| Median | 1,051 | $530,000 | $530,000 | ||||||||||
Market Analysis
List vs Sale $/SqFt
Sale Price Trend
Days on Market
Sale vs List Price
This analysis was generated automatically from MLS data. For an in-depth, human-reviewed valuation, contact Joseph Sardella at josephsardella@gmail.com.