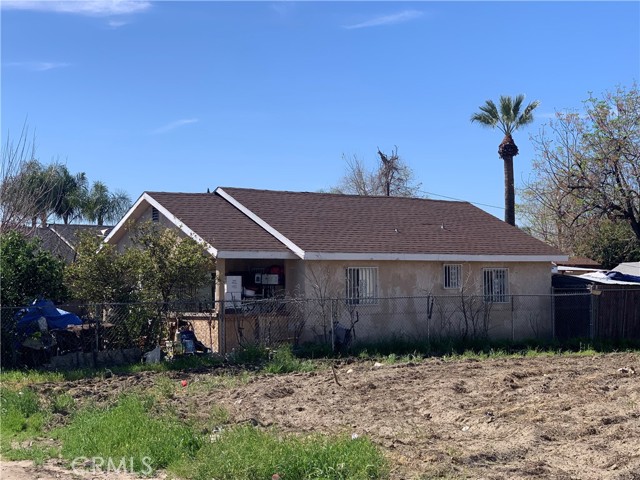
1 / 2
8030 Cooley Street, San Bernardino, CA 92410
$310K2bd · 1ba · 672 sqft
Lot 6,750 sqft•Single Family Residence•Active•236d on market•MLS# CV-26054510
8030 Cooley Street, San Bernardino, CA 92410
MLS# CV-26054510•Residential•Single Family Residence
Active236 days on market
$310,000
2
Beds
1
Baths
672
Sq Ft
6,750
Lot Sq Ft
1937
Year Built
None
View
Property Description
Property is tenant occupied and the tenants will remain.
Features & Amenities
FeeBuilt 1937
Property Details
Land Type
Fee
Year Built
1937
Property Type
Residential
Property Subtype
Single Family Residence
Parking Spaces
0
Garage Spaces
0
Cooling
None
View
None
City
San Bernardino
Zip Code
92410
County
San Bernardino
Mortgage Calculator
Current Rates
$
$
%
Monthly Payment
$1,567.53
Principal & Interest
Loan Amount
$248,000
Total Interest
$316,310
Total Payment Over 30 Years
$564,310
This calculator provides estimates only. Actual mortgage payments may include taxes, insurance, HOA fees, and PMI. Contact a lender for accurate quotes.
Comparative Market Analysis
Affordable Tier · 1 active · 5 closed
8030 Cooley Street, San Bernardino, CA 92410
San Bernardino · Single Family Residence
$310K
Affordable TierBeds
2
Baths
1
Sqft
672
Lot
6,750 sqft
Year
1937
$/Sqft
$461
Pool: No✓
View: None✓
Listed 3.3% above the median closed sale of $300,000. Closed comps sold at 89% of list — buyers have negotiating leverage.
Price Position
Aligned with the market — fair pricing for the comps.
At market
Subject listed at $310K· $461/sqft
Total list price
Closed comps
vs closed median $300K
+$10K (+3.3%)
Active comps
vs active median $355K
−$45K (−12.7%)
Price per sqft
Closed compsinsufficient comp data
Active comps
vs active avg $/sqft $581
−$120 (−20.7%)
Active Properties (1)
Active Comparables
| Address | City | Year | BD | BTH | SqFt | LotSz | LP/SqFt | LP | DIM | Score |
|---|---|---|---|---|---|---|---|---|---|---|
| 26079 9th | Highland | 1952 | 2 | 1 | 611 | 3,805 | $581 | $355,000 | 285 | 67 |
| Total: 1 · Average | 2.0 | 1.0 | 611 | 3,805 | $581 | $355,000 | 285 | |||
| Median | 611 | $355,000 | ||||||||
Closed Properties (5)
Closed Comparables
| Address | City | Year | Date | BD | BTH | SqFt | LotSz | LP | SP | SP/SqFt | SP/LP | DIM | Score |
|---|---|---|---|---|---|---|---|---|---|---|---|---|---|
| 654 OLIVE | San Bernardino | 1926 | 08/12/2026 | 2 | 1 | 652 | 5,600 | $329,900 | $292,000 | $448 | 0.89 | 73 | 81 |
| 460 Berkeley Avenue | San Bernardino | 1951 | 10/27/2026 | 2 | 1 | 600 | 9,500 | $335,000 | $335,000 | $558 | 1.00 | 40 | 80 |
| 354 13th | San Bernardino | 1923 | 06/30/2026 | 2 | 1 | 720 | 5,250 | $329,500 | $300,000 | $417 | 0.91 | 62 | 77 |
| 821 Spruce | San Bernardino | 1915 | 06/25/2026 | 2 | 1 | 624 | 2,537 | $399,000 | $285,000 | $457 | 0.71 | 143 | 76 |
| 24976 7th Street | San Bernardino | 1946 | 07/14/2026 | 2 | 1 | 960 | 6,780 | $355,000 | $335,000 | $349 | 0.94 | 109 | 75 |
| Total: 5 · Average | 2.0 | 1.0 | 711.2 | 5,933.4 | $309,400 | $309,400 | $445.8 | — | 85.4 | ||||
| Median | 652 | $300,000 | $300,000 | ||||||||||
Market Analysis
List vs Sale $/SqFt
Sale Price Trend
Days on Market
Sale vs List Price
AI-generated CMA
This analysis was generated automatically from MLS data. For an in-depth, human-reviewed valuation, contact Joseph Sardella at josephsardella@gmail.com.