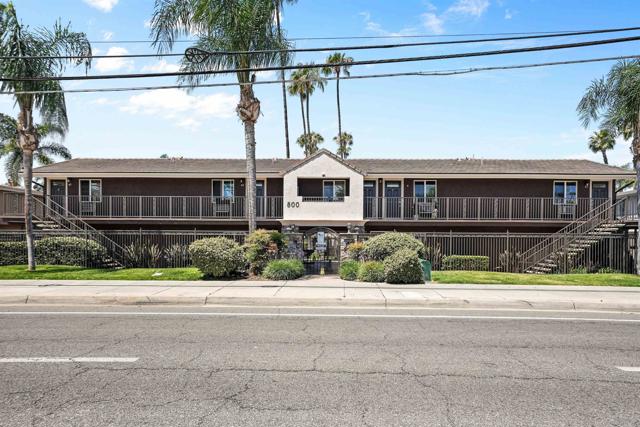
800 North Mollison Avenue, 10, El Cajon, CA 92021
800 North Mollison Avenue, 10, El Cajon, CA 92021
Property Description
Currently THE LOWEST PRICED home in the complex, 800 N Mollison Ave #10 offers a great opportunity in the heart of El Cajon. This condo features a practical layout, comfortable living space, and convenient access to nearby shopping, dining, schools, and major freeways. The community offers several amenities, including a barbecue area, gym, pool, and more, adding convenience and value for everyday living. Whether you’re a first-time buyer, an investor, or looking to downsize, this home gives you the chance to enter the market at an approachable price point. Bring your vision and make it your own.
Features & Amenities
Property Details
Mortgage Calculator
Current Rates
Comparative Market Analysis
Affordable Tier · 5 active · 5 closed
El Cajon · Condominium
Listed in line with the median closed sale of $299,000. Price per sqft ($641) is a 22% premium to closed comps ($525). Closed comps sold at 101% of list — strong seller's market.
Price Position
Aligned with the market — fair pricing for the comps.
Active Properties (5)
Active Comparables
| Address | City | Year | BD | BTH | SqFt | LotSz | LP/SqFt | LP | DIM | Score |
|---|---|---|---|---|---|---|---|---|---|---|
| 800 Mollison | El Cajon | 1995 | 1 | 1 | 460 | 0 | $598 | $275,000 | 100 | 93 |
| 930 Peach Avenue | El Cajon | 1990 | 1 | 1 | 625 | 37,724 | $496 | $310,000 | 10 | 83 |
| 1045 Peach Avenue | El Cajon | 1985 | 1 | 1 | 721 | 106,286 | $415 | $299,000 | 109 | 73 |
| 467 Ballantyne St | El Cajon | 1987 | 1 | 1 | 710 | 0 | $413 | $293,000 | 153 | 73 |
| 540 Oakdale Lane | El Cajon | 1965 | 1 | 1 | 704 | 218,671 | $389 | $274,000 | 38 | 66 |
| Total: 5 · Average | 1.0 | 1.0 | 644 | 120,893.667 | $462.2 | $290,200 | 82 | |||
| Median | 704 | $293,000 | ||||||||
Closed Properties (5)
Closed Comparables
| Address | City | Year | Date | BD | BTH | SqFt | LotSz | LP | SP | SP/SqFt | SP/LP | DIM | Score |
|---|---|---|---|---|---|---|---|---|---|---|---|---|---|
| 800 Mollison Avenue | El Cajon | 1995 | 10/28/2026 | 1 | 1 | 460 | 0 | $299,000 | $299,000 | $650 | 1.00 | 70 | 95 |
| 930 Peach Avenue | El Cajon | 1990 | 09/23/2026 | 1 | 1 | 625 | 0 | $275,000 | $285,000 | $456 | 1.04 | 186 | 83 |
| 1423 Graves Avenue | El Cajon | 1995 | 12/05/2025 | 1 | 1 | 597 | 451,359 | $325,000 | $335,000 | $561 | 1.03 | 122 | 75 |
| 559 Madison Avenue | El Cajon | 1987 | 08/20/2026 | 1 | 1 | 710 | 163,211 | $299,000 | $299,000 | $421 | 1.00 | 50 | 74 |
| 1423 Graves Avenue | El Cajon | 1995 | 12/23/2025 | 1 | 1 | 597 | 0 | $319,900 | $319,900 | $536 | 1.00 | 71 | 72 |
| Total: 5 · Average | 1.0 | 1.0 | 597.8 | 307,285 | $307,580 | $307,580 | $524.8 | — | 99.8 | ||||
| Median | 597 | $299,000 | $299,000 | ||||||||||
Market Analysis
List vs Sale $/SqFt
Sale Price Trend
Days on Market
Sale vs List Price
This analysis was generated automatically from MLS data. For an in-depth, human-reviewed valuation, contact Joseph Sardella at josephsardella@gmail.com.