7736 Sugar Drive, Huntington Beach, CA 92647
7736 Sugar Drive, Huntington Beach, CA 92647
Property Description
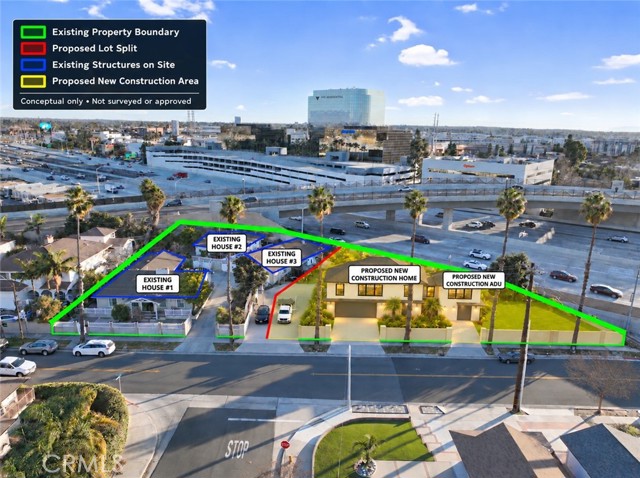
ONE PROPERTY. THREE RESIDENCES. APPROXIMATELY 22,800 SQ. FT. OF HUNTINGTON BEACH POSSIBILITIES! WELCOME TO 7736 SUGAR DRIVE—WHERE THE SPACE YOU HAVE TODAY MAY BE JUST THE BEGINNING! Looking for more than the typical Huntington Beach home? This distinctive property combines a spacious single-story main residence, two additional residences, existing rental income, and a large parcel with room to explore future possibilities. Whether you’re envisioning a long-term home, a multigenerational arrangement, or an investment with development potential, take a closer look! THE MAIN RESIDENCE offers four bedrooms and three bathrooms, including TWO PRIMARY SUITES with private baths, plus TWO FIREPLACES. A studio with kitchenette and full bathroom and a separate two-bedroom, one-bathroom residence with kitchen area and living room complete the improvements. Together, the three residences offer approximately 4,250 square feet of combined living space. All are currently tenant-occupied under month-to-month agreements. AND THEN THERE’S THE LAND! Three residences are positioned together on one portion of the approximately 22,800-square-foot parcel, leaving a substantial adjacent area currently used in part as a tennis/basketball court. Imagine the possibilities for this underutilized space! Conceptual renderings and site layouts illustrate ONE potential scenario: retain the existing residences while exploring a new approximately 2,300-square-foot, two-story home and an approximately 1,200-square-foot, two-story ADU. A possible lot split could also be evaluated. These are ideas for investigation—not approved projects or promises of buildability. LIVE, INVEST, OR PLAN FOR THE FUTURE! Current rentals offer income today, while the property’s layout invites buyers to study longer-term strategies. Owner occupancy, multigenerational use, changes to tenancy, and construction are subject to applicable rights, rules, and approvals. DON’T JUST LOOK AT WHAT’S HERE. IMAGINE WHAT COULD BE NEXT! Review the aerial photos and conceptual illustrations, then schedule a private tour. All areas approximate. Property sold with existing tenants; vacant possession is not guaranteed. Buyer to verify legal unit status, tenancy and occupancy rights, zoning, permitted uses, dimensions, access, easements, utilities, development feasibility, costs and approvals. Renderings are conceptual; ADU, new home and subdivision are not approved or guaranteed.
Features & Amenities
Property Details
Mortgage Calculator
Current Rates
Comparative Market Analysis
Luxury Tier · 3 active · 4 closed
Huntington Beach · Single Family Residence
Listed 7.0% above the median closed sale of $2,431,000. Price per sqft ($612) is a 16% discount to closed comps ($727). Closed comps sold at 94% of list — buyers have negotiating leverage. Luxury tier — fewer comparable sales widen the confidence range.
Price Position
Positioned above the market — commands a premium.
Active Properties (3)
Active Comparables
| Address | City | Year | BD | BTH | SqFt | LotSz | LP/SqFt | LP | DIM | Score |
|---|---|---|---|---|---|---|---|---|---|---|
| 16029 Basil | Fountain Valley | 1973 | 5 | 4 | 2,328 | 11,600 | $1,112 | $2.59M | 9 | 48 |
| 6402 Athena Drive | Huntington Beach | 1965 | 4 | 3 | 3,020 | 10,200 | $960 | $2.90M | 11 | 46 |
| 7921 Ronald Drive | Huntington Beach | 1957 | 4 | 2 | 1,444 | 9,148 | $1,789 | $2.58M | 139 | 41 |
| Total: 3 · Average | 4.3 | 3.0 | 2,264 | 10,316 | $1,287 | $2.69M | 53 | |||
| Median | 2,328 | $2.59M | ||||||||
Closed Properties (4)
Closed Comparables
| Address | City | Year | Date | BD | BTH | SqFt | LotSz | LP | SP | SP/SqFt | SP/LP | DIM | Score |
|---|---|---|---|---|---|---|---|---|---|---|---|---|---|
| 9306 Lily Avenue | Fountain Valley | 2008 | 05/18/2026 | 5 | 4 | 3,522 | 7,209 | $2.44M | $2.46M | $699 | 1.01 | 70 | 55 |
| 17777 Joshua Cir | Fountain Valley | 2021 | 09/24/2026 | 5 | 5 | 4,029 | 7,202 | $3.19M | $2.50M | $621 | 0.78 | 131 | 54 |
| 33401 Via De Agua | San Juan Capistrano | 1976 | 06/10/2026 | 4 | 3 | 3,097 | 17,600 | $2.50M | $2.40M | $775 | 0.96 | 34 | 39 |
| 5522 Mossvale Circle | Huntington Beach | 1973 | 06/01/2026 | 4 | 3 | 2,740 | 6,175 | $2.25M | $2.23M | $812 | 0.99 | 101 | 26 |
| Total: 4 · Average | 4.5 | 3.8 | 3,347 | 9,546.5 | $2.40M | $2.40M | $726.75 | — | 84 | ||||
| Median | 3,522 | $2.46M | $2.46M | ||||||||||
Market Analysis
List vs Sale $/SqFt
Sale Price Trend
Days on Market
Sale vs List Price
This analysis was generated automatically from MLS data. For an in-depth, human-reviewed valuation, contact Joseph Sardella at josephsardella@gmail.com.