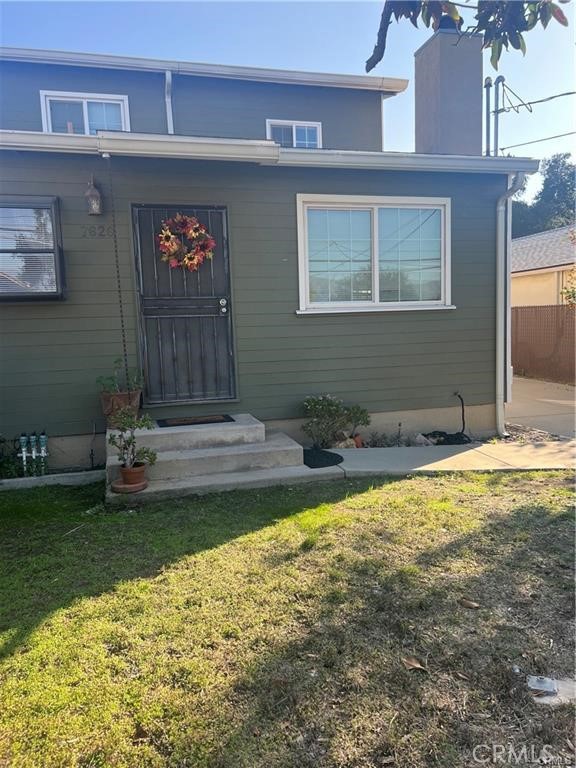
1 / 1
7626 Valmont, Tujunga, CA 91042
$780K3bd · 2ba · 1,266 sqft
Lot 5,455 sqft•Single Family Residence•Active•206d on market•MLS# SR-26060398
7626 Valmont, Tujunga, CA 91042
MLS# SR-26060398•Residential•Single Family Residence
Active206 days on market
$780,000
3
Beds
2
Baths
1,266
Sq Ft
5,455
Lot Sq Ft
1945
Year Built
Mountain(s), See Remarks
View
Property Description
Charming 3-bedroom, 2-bath home with 1,266 sq?ft of living space on a 5,453?sq?ft lot. Built in 1945, it offers mountain views, central air, a gas fireplace, and a detached two-car garage in a quiet Tujunga neighborhood.
Features & Amenities
FeeBuilt 1945
Property Details
Land Type
Fee
Year Built
1945
Property Type
Residential
Property Subtype
Single Family Residence
Heating
Central
Cooling
Central Air, Electric, None
View
Mountain(s), See Remarks
City
Tujunga
Zip Code
91042
County
Los Angeles
Mortgage Calculator
Current Rates
$
$
%
Monthly Payment
$3,944.10
Principal & Interest
Loan Amount
$624,000
Total Interest
$795,878
Total Payment Over 30 Years
$1,419,878
This calculator provides estimates only. Actual mortgage payments may include taxes, insurance, HOA fees, and PMI. Contact a lender for accurate quotes.
Comparative Market Analysis
Affordable Tier · 5 active · 5 closed
7626 Valmont, Tujunga, CA 91042
Tujunga · Single Family Residence
$780K
Affordable TierBeds
3
Baths
2
Sqft
1,266
Lot
5,455 sqft
Year
1945
$/Sqft
$616
Pool: No✓
View: mountain✓
Listed 7.1% below the median closed sale of $840,000. Price per sqft ($616) is a 21% discount to closed comps ($777). Closed comps sold at 101% of list — strong seller's market.
Price Position
Priced below the market — value advantage over the field.
Price advantage
Subject listed at $780K· $616/sqft
Total list price
Closed comps
vs closed median $840K
−$60K (−7.1%)
Active comps
vs active median $800K
−$20K (−2.5%)
Price per sqft
Closed compsinsufficient comp data
Active comps
vs active avg $/sqft $706
−$90 (−12.8%)
Active Properties (5)
Active Comparables
| Address | City | Year | BD | BTH | SqFt | LotSz | LP/SqFt | LP | DIM | Score |
|---|---|---|---|---|---|---|---|---|---|---|
| 10310 Wilsey | Tujunga | 1950 | 4 | 2 | 1,361 | 4,892 | $587 | $799,000 | 131 | 85 |
| 10634 Fitzroy Avenue | Los Angeles | 1925 | 3 | 2 | 1,167 | 6,261 | $685 | $799,900 | 16 | 81 |
| 7860 Fenwick Street | Sunland | 1975 | 3 | 2 | 1,254 | 5,376 | $662 | $830,000 | 44 | 80 |
| 7444 Tranquil Drive | Tujunga | 1924 | 2 | 1 | 1,120 | 45,577 | $749 | $839,000 | 27 | 74 |
| 10610 Woodward | Sunland | 1928 | 2 | 1 | 936 | 7,159 | $849 | $795,000 | 80 | 72 |
| Total: 5 · Average | 2.8 | 1.6 | 1,167.6 | 13,853 | $706.4 | $812,580 | 59.6 | |||
| Median | 1,167 | $799,900 | ||||||||
Closed Properties (5)
Closed Comparables
| Address | City | Year | Date | BD | BTH | SqFt | LotSz | LP | SP | SP/SqFt | SP/LP | DIM | Score |
|---|---|---|---|---|---|---|---|---|---|---|---|---|---|
| 10437 Helendale Avenue | Los Angeles | 1938 | 12/12/2025 | 2 | 2 | 1,295 | 5,626 | $849,000 | $865,000 | $668 | 1.02 | 37 | 80 |
| 7664 Beckett Street | Tujunga | 1952 | 06/12/2026 | 3 | 2 | 1,837 | 5,629 | $849,999 | $840,000 | $457 | 0.99 | 42 | 78 |
| 7822 Apperson | Sunland | 1959 | 08/26/2026 | 2 | 1 | 912 | 4,600 | $700,000 | $750,000 | $822 | 1.07 | 43 | 75 |
| 10404 Jardine Avenue | Sunland | 1949 | 11/13/2025 | 2 | 1 | 960 | 8,368 | $899,000 | $890,000 | $927 | 0.99 | 48 | 70 |
| 7916 Glenties Lane | Sunland | 1940 | 09/15/2026 | 1 | 1 | 717 | 356,086 | $749,000 | $725,000 | $1,011 | 0.97 | 92 | 69 |
| Total: 5 · Average | 2.0 | 1.4 | 1,144.2 | 76,061.8 | $814,000 | $814,000 | $777 | — | 52.4 | ||||
| Median | 960 | $840,000 | $840,000 | ||||||||||
Market Analysis
List vs Sale $/SqFt
Sale Price Trend
Days on Market
Sale vs List Price
AI-generated CMA
This analysis was generated automatically from MLS data. For an in-depth, human-reviewed valuation, contact Joseph Sardella at josephsardella@gmail.com.