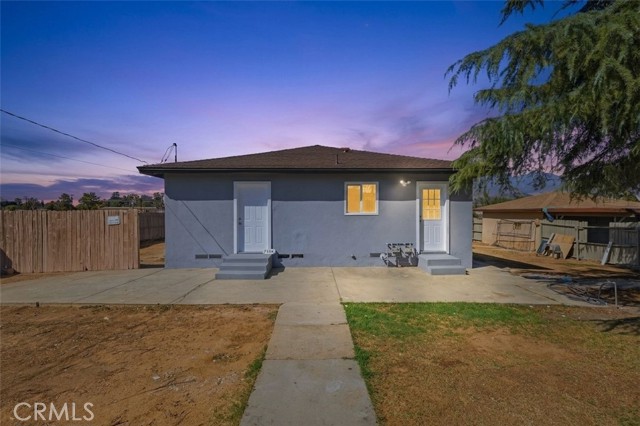
754 East 3rd Street, Beaumont, CA 92223
754 East 3rd Street, Beaumont, CA 92223
Property Description
Great opportunity to own two homes on one spacious lot in Beaumont! Situated on approximately 0.43 acres, this versatile property offers excellent potential for investors, multi-generational living, or buyers looking for additional rental income. The main home features 4 bedrooms and 2 bathrooms, while the second home offers 3 bedrooms and 1 bathroom, providing flexibility and plenty of possibilities. With two separate residences on one lot, this property presents a unique opportunity to live in one home while potentially renting the other, accommodate extended family, or explore investment opportunities. Conveniently located with accessibility to nearby amenities and transportation routes, this property combines space, versatility, and great rental potential. A rare opportunity with endless possibilities—don't miss your chance to make it yours!
Features & Amenities
Property Details
Mortgage Calculator
Current Rates
Comparative Market Analysis
Residential Tier · 5 active · 5 closed
Beaumont · Single Family Residence
Listed 11.1% above the median closed sale of $675,000. Price per sqft ($417) is a 60% premium to closed comps ($260).
Price Position
Positioned above the market — commands a premium.
Active Properties (5)
Active Comparables
| Address | City | Year | BD | BTH | SqFt | LotSz | LP/SqFt | LP | DIM | Score |
|---|---|---|---|---|---|---|---|---|---|---|
| 1127 Edgar Avenue | Beaumont | 1940 | 3 | 2 | 1,651 | 28,314 | $439 | $725,000 | 1231 | 65 |
| 1564 Rio Grande | Beaumont | 2017 | 2 | 3 | 2,482 | 6,970 | $258 | $640,000 | 62 | 64 |
| 340 Mock Bluff | Beaumont | 2018 | 4 | 3 | 2,318 | 5,663 | $298 | $689,900 | 39 | 62 |
| 475 Whitney Peak | Beaumont | 2016 | 2 | 3 | 2,482 | 8,276 | $264 | $655,000 | 25 | 62 |
| 456 Boise Rock | Beaumont | 2011 | 4 | 4 | 2,635 | 8,276 | $280 | $739,000 | 66 | 60 |
| Total: 5 · Average | 3.0 | 3.0 | 2,313.6 | 11,499.8 | $307.8 | $689,780 | 284.6 | |||
| Median | 2,482 | $689,900 | ||||||||
Closed Properties (5)
Closed Comparables
| Address | City | Year | Date | BD | BTH | SqFt | LotSz | LP | SP | SP/SqFt | SP/LP | DIM | Score |
|---|---|---|---|---|---|---|---|---|---|---|---|---|---|
| 330 Song Bird | Beaumont | 2018 | 08/28/2026 | 2 | 3 | 2,482 | 6,534 | $699,900 | $699,900 | $282 | 1.00 | 42 | 59 |
| 1535 Edgebrook | Beaumont | 2015 | 09/14/2026 | 2 | 3 | 2,412 | 10,019 | $689,000 | $675,000 | $280 | 0.98 | 81 | 58 |
| 1067 Gold Finch | Beaumont | 2003 | 05/18/2026 | 6 | 3 | 3,148 | 7,405 | $670,000 | $670,000 | $213 | 1.00 | 87 | 58 |
| 391 Arroyo | Beaumont | 2015 | 08/25/2026 | 2 | 3 | 2,283 | 6,534 | $765,000 | $765,000 | $335 | 1.00 | 33 | 57 |
| 1235 Jackson Court | Beaumont | 2006 | 02/23/2026 | 5 | 4 | 3,437 | 10,019 | $649,555 | $660,000 | $192 | 1.02 | 35 | 56 |
| Total: 5 · Average | 3.4 | 3.2 | 2,752.4 | 8,102.2 | $693,980 | $693,980 | $260.4 | — | 55.6 | ||||
| Median | 2,482 | $675,000 | $675,000 | ||||||||||
Market Analysis
List vs Sale $/SqFt
Sale Price Trend
Days on Market
Sale vs List Price
This analysis was generated automatically from MLS data. For an in-depth, human-reviewed valuation, contact Joseph Sardella at josephsardella@gmail.com.