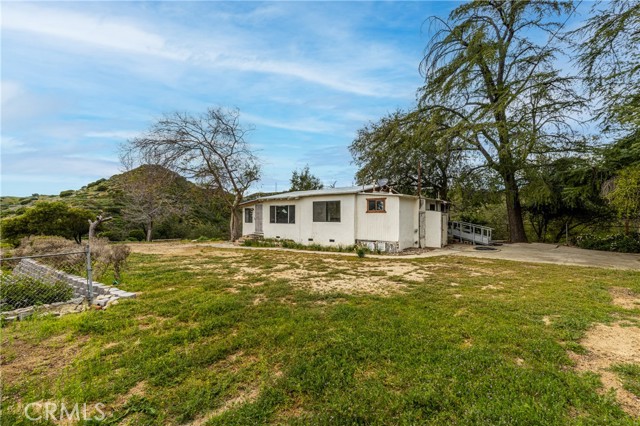
7444 Tranquil Drive, Tujunga, CA 91042
7444 Tranquil Drive, Tujunga, CA 91042
Property Description
Once in a life time opportunity to own a home within the city of Tujunga that offers 45,577 (over an Acre) square feet of land which is usable for luxury development with existing flat pads and possibilities of multiple homes or a mini estate development with lots of privacy and hillside views and miles of hiking trails. There are 10 legal parcels in addition to the parcel which the 1120 square feet home sits on that offer potential for development. The existing home is in fair condition to be used while the other lots could be developed. You must see to appreciate this property. The following are the legal parcel numbers of all the lots. These are the APNs of the 11 parcels:(2562012015, 2562012016, 2562012018, 2562012019, 2562012020, 2562012021, 2562012009, 2562012010, 2562012011, 2562012012, 2562012042 ). See attached supplemental plat maps.
Features & Amenities
Property Details
Mortgage Calculator
Current Rates
Comparative Market Analysis
Affordable Tier · 5 active · 5 closed
Tujunga · Single Family Residence
Listed in line with the median closed sale of $840,000.
Price Position
Aligned with the market — fair pricing for the comps.
Active Properties (5)
Active Comparables
| Address | City | Year | BD | BTH | SqFt | LotSz | LP/SqFt | LP | DIM | Score |
|---|---|---|---|---|---|---|---|---|---|---|
| 10143 Mountair Avenue | Los Angeles | 1927 | 2 | 1 | 945 | 5,504 | $979 | $925,000 | 7 | 82 |
| 10610 Woodward | Sunland | 1928 | 2 | 1 | 936 | 7,159 | $849 | $795,000 | 80 | 76 |
| 10634 Fitzroy Avenue | Los Angeles | 1925 | 3 | 2 | 1,167 | 6,261 | $685 | $799,900 | 16 | 74 |
| 9704 Marcus Lane | Tujunga | 1972 | 3 | 2 | 1,158 | 10,477 | $750 | $869,000 | 18 | 71 |
| 7626 Valmont | Tujunga | 1945 | 3 | 2 | 1,266 | 5,455 | $616 | $780,000 | 204 | 68 |
| Total: 5 · Average | 2.6 | 1.6 | 1,094.4 | 6,971.2 | $775.8 | $833,780 | 65 | |||
| Median | 1,158 | $799,900 | ||||||||
Closed Properties (5)
Closed Comparables
| Address | City | Year | Date | BD | BTH | SqFt | LotSz | LP | SP | SP/SqFt | SP/LP | DIM | Score |
|---|---|---|---|---|---|---|---|---|---|---|---|---|---|
| 7118 Valmont Street | Tujunga | 1938 | 10/06/2026 | 2 | 2 | 918 | 4,509 | $799,000 | $795,000 | $866 | 0.99 | 75 | 72 |
| 7916 Glenties Lane | Sunland | 1940 | 09/15/2026 | 1 | 1 | 717 | 356,086 | $749,000 | $725,000 | $1,011 | 0.97 | 92 | 72 |
| 7539 Valaho Drive | Los Angeles | 1981 | 05/01/2026 | 3 | 3 | 1,651 | 5,199 | $899,000 | $900,000 | $545 | 1.00 | 45 | 57 |
| 7664 Beckett Street | Tujunga | 1952 | 06/12/2026 | 3 | 2 | 1,837 | 5,629 | $849,999 | $840,000 | $457 | 0.99 | 42 | 54 |
| 10129 Plainview Avenue | Tujunga | 1947 | 11/24/2025 | 3 | 3 | 1,613 | 5,503 | $895,000 | $904,890 | $561 | 1.01 | 46 | 53 |
| Total: 5 · Average | 2.4 | 2.2 | 1,347.2 | 75,385.2 | $832,978 | $832,978 | $688 | — | 60 | ||||
| Median | 1,613 | $840,000 | $840,000 | ||||||||||
Market Analysis
List vs Sale $/SqFt
Sale Price Trend
Days on Market
Sale vs List Price
This analysis was generated automatically from MLS data. For an in-depth, human-reviewed valuation, contact Joseph Sardella at josephsardella@gmail.com.