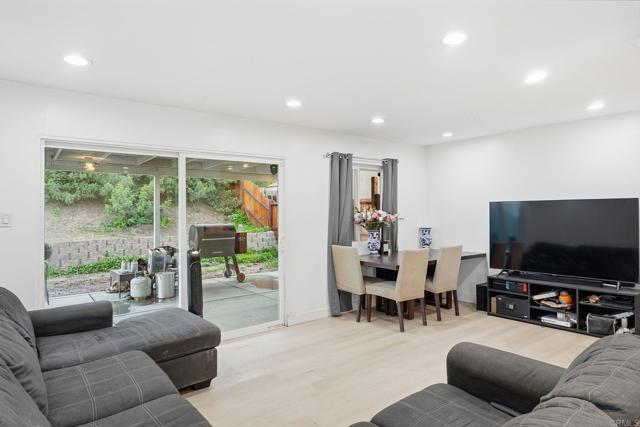
738 Carlsbad Street, Spring Valley, CA 91977
738 Carlsbad Street, Spring Valley, CA 91977
Property Description
Tucked into an established neighborhood, this home offers a comfortable setting with everyday essentials, shopping, dining, and major routes just minutes away—making it easy to get to Downtown San Diego, the coast, and everything in between. Inside, you’ll find a functional layout designed for both daily living and entertaining, with inviting living spaces and a natural flow from room to room. Outdoors, enjoy a private yard space ready for weekend BBQs, gardening, play, or simply relaxing under the San Diego sunshine. Whether you’re looking for a place to settle in and make your own or a smart investment in a consistently in-demand area, this Spring Valley address checks the boxes for location, lifestyle, and long-term potential
Features & Amenities
Property Details
Mortgage Calculator
Current Rates
Comparative Market Analysis
Affordable Tier · 5 active · 5 closed
Spring Valley · Single Family Residence
Listed in line with the median closed sale of $585,535.
Price Position
Aligned with the market — fair pricing for the comps.
Active Properties (5)
Active Comparables
| Address | City | Year | BD | BTH | SqFt | LotSz | LP/SqFt | LP | DIM | Score |
|---|---|---|---|---|---|---|---|---|---|---|
| 242 Old Oak Dr. | San Diego | 1962 | 3 | 2 | 966 | 5,598 | $621 | $600,000 | 12 | 84 |
| 7515 Jamacha Road | San Diego | 1987 | 2 | 2 | 1,022 | 60,984 | $547 | $559,000 | 62 | 80 |
| 636 Pecos Street | Spring Valley | 1983 | 2 | 2 | 985 | 2,614 | $640 | $629,999 | 11 | 78 |
| 9838 Ivanho Street | Spring Valley | 1970 | 3 | 1 | 1,134 | 5,000 | $582 | $660,000 | 3 | 75 |
| 2115 Manzana Way | Paradise Hills | 1985 | 3 | 3 | 1,586 | 2,331 | $385 | $610,000 | 17 | 72 |
| Total: 5 · Average | 2.6 | 2.0 | 1,138.6 | 15,305.4 | $555 | $611,799.8 | 21 | |||
| Median | 1,022 | $610,000 | ||||||||
Closed Properties (5)
Closed Comparables
| Address | City | Year | Date | BD | BTH | SqFt | LotSz | LP | SP | SP/SqFt | SP/LP | DIM | Score |
|---|---|---|---|---|---|---|---|---|---|---|---|---|---|
| 7715 Borrego Street | San Diego | 1978 | 10/08/2026 | 3 | 2 | 1,162 | 5,922 | $659,000 | $585,535 | $504 | 0.89 | 43 | 87 |
| 231 Redcrest Drive | San Diego | 1963 | 01/15/2026 | 3 | 2 | 964 | 6,600 | $689,000 | $685,000 | $711 | 0.99 | 43 | 83 |
| 9017 Orville Street | Spring Valley | 1958 | 04/27/2026 | 3 | 2 | 1,246 | 6,098 | $549,000 | $565,500 | $454 | 1.03 | 41 | 80 |
| 7856 Prairie Mound Way | San Diego | 1964 | 04/02/2026 | 3 | 2 | 1,008 | 5,000 | $677,000 | $655,000 | $650 | 0.97 | 36 | 80 |
| 8338 Stansbury | Spring Valley | 1960 | 06/12/2026 | 3 | 1 | 1,000 | 6,534 | $595,000 | $550,000 | $550 | 0.92 | 21 | 79 |
| Total: 5 · Average | 3.0 | 1.8 | 1,076 | 6,030.8 | $608,207 | $608,207 | $573.8 | — | 36.8 | ||||
| Median | 1,008 | $585,535 | $585,535 | ||||||||||
Market Analysis
List vs Sale $/SqFt
Sale Price Trend
Days on Market
Sale vs List Price
This analysis was generated automatically from MLS data. For an in-depth, human-reviewed valuation, contact Joseph Sardella at josephsardella@gmail.com.