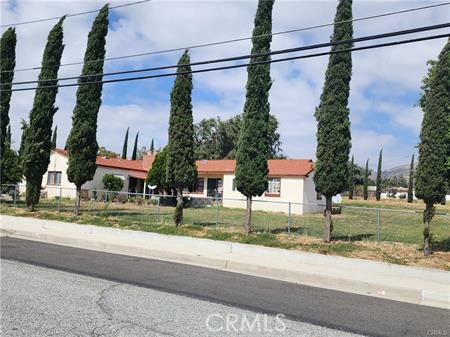
725 East Williams, Banning, CA 92220
725 East Williams, Banning, CA 92220
Property Description
Attention builders, developers, and savvy investors—725 E Williams St represents a rare, high-yield opportunity in the rapidly expanding Banning market. Boasting a massive, level 1.68-acre lot, this property offers the perfect combination of immediate rental income and massive future upside.The property features a spacious 1,744 sq ft home (3 beds, 1 full bath, 2 half baths, and a 3-car garage) that is currently occupied by reliable tenants. This provides an excellent turnkey setup to generate steady holding income while you navigate architectural planning, engineering, and city permits.Per the City of Banning, the true value lies in the land, which is zoned HDR (High Density Residential). This zoning permits a density baseline of 11 to 18 units per acre, allowing for a 25+ unit build out (with the added possibility of lucrative density bonuses for Senior Housing or Low-Income Housing initiatives). PROPERTY SALES AS IS.
Features & Amenities
Property Details
Mortgage Calculator
Current Rates
Comparative Market Analysis
Residential Tier · 5 active · 5 closed
Banning · Single Family Residence
Listed 11.4% above the median closed sale of $700,000. Price per sqft ($447) is a 100% premium to closed comps ($223).
Price Position
Positioned above the market — commands a premium.
Active Properties (5)
Active Comparables
| Address | City | Year | BD | BTH | SqFt | LotSz | LP/SqFt | LP | DIM | Score |
|---|---|---|---|---|---|---|---|---|---|---|
| 514 Victory | Banning | 1964 | 3 | 2 | 1,512 | 95,832 | $446 | $674,999 | 11 | 75 |
| 1424 Charles St | Banning | 2005 | 4 | 2 | 2,378 | 20,909 | $281 | $668,000 | 5 | 71 |
| 295 Summit Drive | Banning | 1990 | 4 | 2 | 1,920 | 52,272 | $383 | $735,000 | 57 | 71 |
| 1469 Adam | Banning | 2004 | 4 | 3 | 2,804 | 19,602 | $239 | $669,000 | 107 | 57 |
| 1075 Charles Street | Banning | 2005 | 5 | 3 | 2,863 | 20,038 | $244 | $699,000 | 318 | 53 |
| Total: 5 · Average | 4.0 | 2.4 | 2,295.4 | 41,730.6 | $318.6 | $689,199.8 | 99.6 | |||
| Median | 2,378 | $674,999 | ||||||||
Closed Properties (5)
Closed Comparables
| Address | City | Year | Date | BD | BTH | SqFt | LotSz | LP | SP | SP/SqFt | SP/LP | DIM | Score |
|---|---|---|---|---|---|---|---|---|---|---|---|---|---|
| 435 Indian School | Banning | 1981 | 08/20/2026 | 4 | 3 | 2,973 | 54,014 | $715,000 | $710,000 | $239 | 0.99 | 140 | 62 |
| 1112 Charles Street | Banning | 2005 | 06/26/2025 | 4 | 3 | 2,804 | 20,038 | $725,000 | $695,000 | $248 | 0.96 | 189 | 52 |
| 391 Gilman Street | Banning | 1927 | 06/20/2025 | 5 | 3 | 2,747 | 18,295 | $649,900 | $675,000 | $246 | 1.04 | 63 | 41 |
| 33 Repplier Road | Banning | 1914 | 08/22/2025 | 6 | 3 | 4,655 | 28,750 | $749,900 | $700,000 | $150 | 0.93 | 128 | 39 |
| 1526 Adam Street | Banning | 2004 | 11/21/2024 | 5 | 5 | 3,053 | 20,038 | $690,000 | $710,000 | $233 | 1.03 | 35 | 32 |
| Total: 5 · Average | 4.8 | 3.4 | 3,246.4 | 28,227 | $698,000 | $698,000 | $223.2 | — | 111 | ||||
| Median | 2,973 | $700,000 | $700,000 | ||||||||||
Market Analysis
List vs Sale $/SqFt
Sale Price Trend
Days on Market
Sale vs List Price
This analysis was generated automatically from MLS data. For an in-depth, human-reviewed valuation, contact Joseph Sardella at josephsardella@gmail.com.