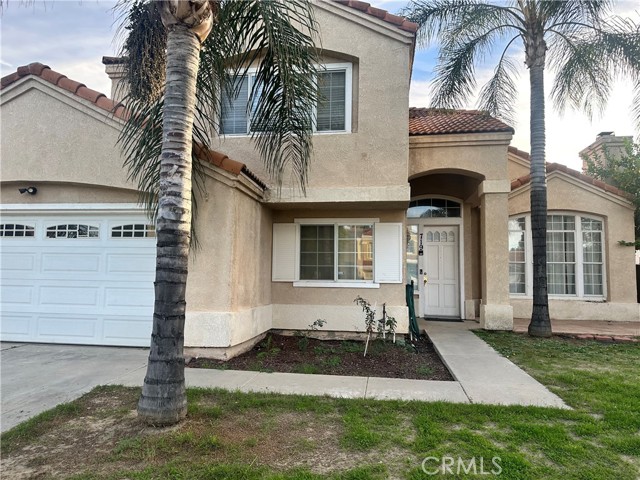
1 / 1
719 Camelia, Perris, CA 92571
$400K3bd · 3ba · 1,599 sqft
Lot 7,405 sqft•Single Family Residence•Active•3d on market•MLS# IV-26234249
719 Camelia, Perris, CA 92571
MLS# IV-26234249•Residential•Single Family Residence
Active3 days on market
$400,000
3
Beds
3
Baths
1,599
Sq Ft
7,405
Lot Sq Ft
1990
Year Built
None
View
Features & Amenities
FeeBuilt 1990
Property Details
Land Type
Fee
Year Built
1990
Property Type
Residential
Property Subtype
Single Family Residence
Parking Spaces
2
Garage Spaces
2
Heating
Central
Cooling
Central Air
View
None
City
Perris
Zip Code
92571
County
Riverside
Mortgage Calculator
Current Rates
$
$
%
Monthly Payment
$2,022.62
Principal & Interest
Loan Amount
$320,000
Total Interest
$408,142
Total Payment Over 30 Years
$728,142
This calculator provides estimates only. Actual mortgage payments may include taxes, insurance, HOA fees, and PMI. Contact a lender for accurate quotes.
Comparative Market Analysis
Affordable Tier · 3 active · 5 closed
719 Camelia, Perris, CA 92571
Perris · Single Family Residence
$400K
Affordable TierBeds
3
Baths
3
Sqft
1,599
Lot
7,405 sqft
Year
1990
$/Sqft
$250
Pool: No✓
View: None✓
Garage: 2-car✓
Listed 9.1% below the median closed sale of $440,000. Price per sqft ($250) is a 39% discount to closed comps ($411).
Price Position
Priced below the market — value advantage over the field.
Price advantage
Subject listed at $400K· $250/sqft
Total list price
Closed comps
vs closed median $440K
−$40K (−9.1%)
Active comps
vs active median $450K
−$50K (−11.1%)
Price per sqft
Closed compsinsufficient comp data
Active comps
vs active avg $/sqft $393
−$143 (−36.3%)
Active Properties (3)
Active Comparables
| Address | City | Year | BD | BTH | SqFt | LotSz | LP/SqFt | LP | DIM | Score |
|---|---|---|---|---|---|---|---|---|---|---|
| 575 Prairie Way | Perris | 1988 | 3 | 2 | 900 | 4,356 | $506 | $455,000 | 1 | 83 |
| 317 8th | Perris | 1989 | 3 | 2 | 1,318 | 6,970 | $341 | $450,000 | 149 | 68 |
| 3896 Manquelo Court | Perris | 2004 | 3 | 2 | 1,283 | 3,920 | $331 | $425,000 | 24 | 65 |
| Total: 3 · Average | 3.0 | 2.0 | 1,167 | 5,082 | $392.667 | $443,333.333 | 58 | |||
| Median | 1,283 | $450,000 | ||||||||
Closed Properties (5)
Closed Comparables
| Address | City | Year | Date | BD | BTH | SqFt | LotSz | LP | SP | SP/SqFt | SP/LP | DIM | Score |
|---|---|---|---|---|---|---|---|---|---|---|---|---|---|
| 487 Lassa Way | Perris | 1992 | 11/12/2025 | 3 | 2 | 1,424 | 4,356 | $459,900 | $460,000 | $323 | 1.00 | 78 | 83 |
| 2107 Star Thistle | Perris | 1992 | 11/24/2025 | 4 | 3 | 1,391 | 3,920 | $450,000 | $385,000 | $277 | 0.86 | 25 | 82 |
| 2355 Stonybrook Way | Perris | 1989 | 06/12/2026 | 3 | 2 | 1,000 | 5,227 | $459,990 | $460,000 | $460 | 1.00 | 59 | 82 |
| 484 Harvest | Perris | 1988 | 01/27/2026 | 3 | 2 | 900 | 4,356 | $399,000 | $410,000 | $456 | 1.03 | 125 | 76 |
| 513 Wildwood | Perris | 1988 | 02/09/2026 | 2 | 1 | 820 | 4,356 | $439,000 | $440,000 | $537 | 1.00 | 41 | 69 |
| Total: 5 · Average | 3.0 | 2.0 | 1,107 | 4,443 | $431,000 | $431,000 | $410.6 | — | 65.6 | ||||
| Median | 1,000 | $440,000 | $440,000 | ||||||||||
Market Analysis
List vs Sale $/SqFt
Sale Price Trend
Days on Market
Sale vs List Price
AI-generated CMA
This analysis was generated automatically from MLS data. For an in-depth, human-reviewed valuation, contact Joseph Sardella at josephsardella@gmail.com.