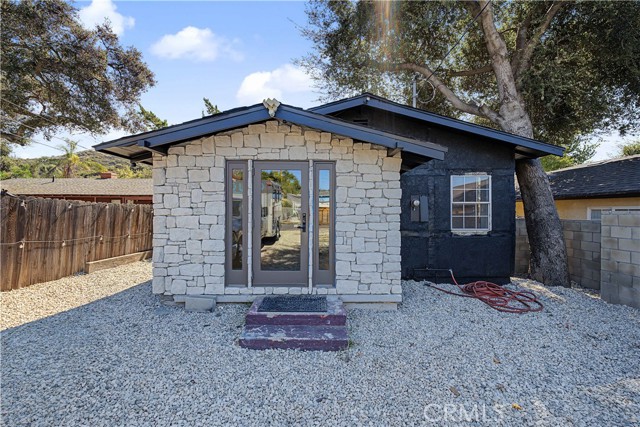
7050 Shadygrove, Tujunga, CA 91042
7050 Shadygrove, Tujunga, CA 91042
Property Description
Welcome to this beautifully updated 1-bedroom, 1-bathroom home offering 751 sq. ft. of comfortable living space in the heart of Tujunga. The property is fully gated with code access, providing privacy and peace of mind from the moment you arrive. Step inside to a spacious living area filled with natural light, creating a warm and inviting atmosphere throughout. The upgraded kitchen features modern finishes and is ready for everyday cooking or entertaining, while the remodeled bathroom adds a fresh, contemporary touch. Indoor laundry adds everyday convenience. A standout feature of this property is the detached 234 sq. ft. Jr. ADU with its own separate entrance. It's ideal for a home office, guest quarters, creative studio, or potential rental income. Tucked in the foothills community of Tujunga, this home offers a relaxed setting with easy access to local shops, dining, and outdoor recreation. Whether you're a first-time buyer, downsizing, or looking for flexible living options, this home is a must-see!
Features & Amenities
Property Details
Mortgage Calculator
Current Rates
Comparative Market Analysis
Affordable Tier · 3 active · 5 closed
Tujunga · Single Family Residence
Listed 6.4% below the median closed sale of $640,000. Closed comps sold at 101% of list — strong seller's market.
Price Position
Priced below the market — value advantage over the field.
Active Properties (3)
Active Comparables
| Address | City | Year | BD | BTH | SqFt | LotSz | LP/SqFt | LP | DIM | Score |
|---|---|---|---|---|---|---|---|---|---|---|
| 10015 Marcus | Tujunga | 1947 | 3 | 2 | 554 | 3,230 | $1,137 | $629,900 | 225 | 69 |
| 10831 Odell Avenue | Sunland | 1948 | 3 | 1 | 844 | 3,978 | $758 | $640,000 | 21 | 65 |
| 10626 Olive Grove Avenue | Sunland | 1954 | 3 | 2 | 1,157 | 3,913 | $588 | $679,900 | 23 | 47 |
| Total: 3 · Average | 3.0 | 1.7 | 851.667 | 3,707 | $827.667 | $649,933.333 | 89.66666666666667 | |||
| Median | 844 | $640,000 | ||||||||
Closed Properties (5)
Closed Comparables
| Address | City | Year | Date | BD | BTH | SqFt | LotSz | LP | SP | SP/SqFt | SP/LP | DIM | Score |
|---|---|---|---|---|---|---|---|---|---|---|---|---|---|
| 6854 Quinton Lane | Tujunga | 1924 | 04/24/2026 | 2 | 2 | 800 | 1,962 | $589,000 | $589,000 | $736 | 1.00 | 24 | 82 |
| 6813 Haywood Street | Los Angeles | 1929 | 10/16/2026 | 2 | 1 | 550 | 2,165 | $575,000 | $580,000 | $1,055 | 1.01 | 190 | 81 |
| 9738 Commerce Avenue | Tujunga | 1950 | 08/24/2026 | 2 | 1 | 793 | 22,948 | $675,000 | $640,000 | $807 | 0.95 | 110 | 78 |
| 9941 France | Tujunga | 1951 | 06/23/2026 | 2 | 1 | 845 | 6,308 | $599,000 | $660,000 | $781 | 1.10 | 19 | 76 |
| 6812 Quinton Lane | Tujunga | 1936 | 06/02/2026 | 1 | 2 | 1,096 | 3,354 | $649,000 | $650,000 | $593 | 1.00 | 71 | 76 |
| Total: 5 · Average | 1.8 | 1.4 | 816.8 | 7,347.4 | $623,800 | $623,800 | $794.4 | — | 82.8 | ||||
| Median | 800 | $640,000 | $640,000 | ||||||||||
Market Analysis
List vs Sale $/SqFt
Sale Price Trend
Days on Market
Sale vs List Price
This analysis was generated automatically from MLS data. For an in-depth, human-reviewed valuation, contact Joseph Sardella at josephsardella@gmail.com.