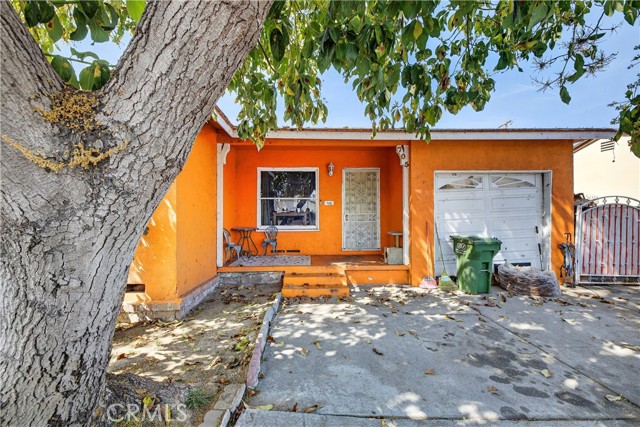
705 South Thorson Avenue, Compton, CA 90221
705 South Thorson Avenue, Compton, CA 90221
Property Description
Charming 3-bedroom, 1-bathroom home located in the city of Compton, just minutes from the 710 Freeway, making commuting convenient. This home offers just under 1,000 square feet of living space and sits on a lot of over 5,000 square feet, providing a spacious backyard with plenty of potential to create your own outdoor retreat. Built in 1948, the property features a 1-car attached garage and is a great opportunity for buyers looking to add their personal touch. With a little TLC, this home can truly shine. Whether you're a first-time buyer, investor, or someone looking to customize a home to your taste, this property offers great potential in a convenient location.
Features & Amenities
Property Details
Mortgage Calculator
Current Rates
Comparative Market Analysis
Affordable Tier · 5 active · 5 closed
Compton · Single Family Residence
Listed 4.9% below the median closed sale of $610,000.
Price Position
Aligned with the market — fair pricing for the comps.
Active Properties (5)
Active Comparables
| Address | City | Year | BD | BTH | SqFt | LotSz | LP/SqFt | LP | DIM | Score |
|---|---|---|---|---|---|---|---|---|---|---|
| 1203 CASTLEGATE Avenue | Compton | 1950 | 2 | 1 | 1,010 | 5,232 | $644 | $650,000 | 73 | 89 |
| 424 WARD Avenue | Compton | 1948 | 2 | 1 | 1,150 | 6,787 | $513 | $590,000 | 19 | 86 |
| 227 Fuego Street | Long Beach | 1948 | 2 | 1 | 928 | 5,110 | $689 | $639,500 | 1 | 85 |
| 609 Crane Avenue Avenue | Compton | 1947 | 2 | 1 | 806 | 4,347 | $744 | $599,900 | 33 | 82 |
| 14517 White | Compton | 1940 | 2 | 1 | 731 | 6,662 | $847 | $619,000 | 4 | 82 |
| Total: 5 · Average | 2.0 | 1.0 | 925 | 5,627.6 | $687.4 | $619,680 | 26 | |||
| Median | 928 | $619,000 | ||||||||
Closed Properties (5)
Closed Comparables
| Address | City | Year | Date | BD | BTH | SqFt | LotSz | LP | SP | SP/SqFt | SP/LP | DIM | Score |
|---|---|---|---|---|---|---|---|---|---|---|---|---|---|
| 201 Harris | Compton | 1942 | 10/29/2026 | 3 | 1 | 1,037 | 5,533 | $630,000 | $664,000 | $640 | 1.05 | 112 | 92 |
| 3625 Marcelle | Compton | 1941 | 09/11/2026 | 3 | 2 | 992 | 5,360 | $655,000 | $625,000 | $630 | 0.95 | 98 | 88 |
| 1106 Washington Avenue | Compton | 1949 | 11/12/2025 | 3 | 1 | 1,036 | 5,018 | $619,000 | $542,500 | $524 | 0.88 | 57 | 87 |
| 519 Holly Street | Compton | 1947 | 07/01/2026 | 2 | 1 | 736 | 5,785 | $599,900 | $610,000 | $829 | 1.02 | 28 | 86 |
| 116 Holly Avenue | Compton | 1946 | 12/08/2025 | 2 | 1 | 1,015 | 6,102 | $599,900 | $605,000 | $596 | 1.01 | 86 | 84 |
| Total: 5 · Average | 2.6 | 1.2 | 963.2 | 5,559.6 | $609,300 | $609,300 | $643.8 | — | 76.2 | ||||
| Median | 1,015 | $610,000 | $610,000 | ||||||||||
Market Analysis
List vs Sale $/SqFt
Sale Price Trend
Days on Market
Sale vs List Price
This analysis was generated automatically from MLS data. For an in-depth, human-reviewed valuation, contact Joseph Sardella at josephsardella@gmail.com.