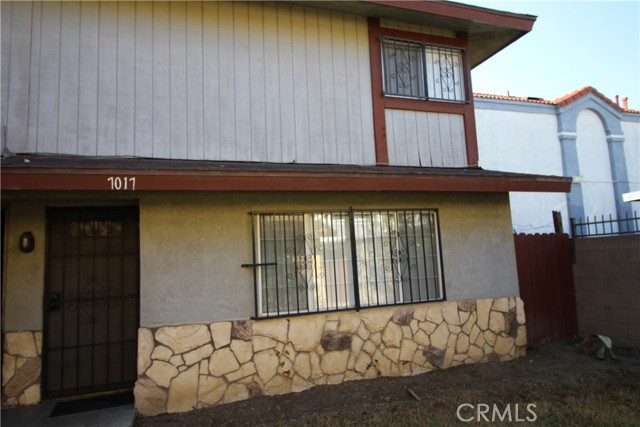
1 / 12
7017 Myrrh Street, Paramount, CA 90723
$490K2bd · 2ba · 1,166 sqft
Lot 14,831 sqft•Condominium•Active•44d on market•MLS# DW-26205117
7017 Myrrh Street, Paramount, CA 90723
MLS# DW-26205117•Residential•Condominium
Active44 days on market
$489,900
2
Beds
2
Baths
1,166
Sq Ft
14,831
Lot Sq Ft
1979
Year Built
None
View
Property Description
Spacious Townhouse Style Condo: End unit with only one common wall. Conveniently Located in West Paramount close to freeway. Nearby schools and parks. Back entrance from a double car garage walk through a private patio and enter through a double glass sliding door.
Features & Amenities
FeeBuilt 1979
Property Details
Land Type
Fee
Year Built
1979
Property Type
Residential
Property Subtype
Condominium
Parking Spaces
2
Garage Spaces
2
Heating
Forced Air
Cooling
Wall/Window Unit(s)
View
None
City
Paramount
Zip Code
90723
County
Los Angeles
Mortgage Calculator
Current Rates
$
$
%
Monthly Payment
$2,477.20
Principal & Interest
Loan Amount
$391,920
Total Interest
$499,872
Total Payment Over 30 Years
$891,792
This calculator provides estimates only. Actual mortgage payments may include taxes, insurance, HOA fees, and PMI. Contact a lender for accurate quotes.
Comparative Market Analysis
Affordable Tier · 5 active · 5 closed
7017 Myrrh Street, Paramount, CA 90723
Paramount · Condominium
$490K
Affordable TierBeds
2
Baths
2
Sqft
1,166
Lot
14,831 sqft
Year
1979
$/Sqft
$420
Pool: No✓
Spa: No✓
View: None✓
Garage: 2-car✓
Listed 4.2% above the median closed sale of $470,000.
Price Position
Aligned with the market — fair pricing for the comps.
At market
Subject listed at $490K· $420/sqft
Total list price
Closed comps
vs closed median $470K
+$20K (+4.2%)
Active comps
vs active median $500K
−$10K (−2.0%)
Price per sqft
Closed compsinsufficient comp data
Active comps
vs active avg $/sqft $457
−$37 (−8.1%)
Active Properties (5)
Active Comparables
| Address | City | Year | BD | BTH | SqFt | LotSz | LP/SqFt | LP | DIM | Score |
|---|---|---|---|---|---|---|---|---|---|---|
| 7258 Exeter | Paramount | 1984 | 2 | 2 | 986 | 18,072 | $507 | $499,999 | 172 | 87 |
| 7304 Exeter Street | Paramount | 1982 | 2 | 2 | 1,017 | 21,085 | $477 | $484,999 | 115 | 85 |
| 6681 Caro Street | Paramount | 1980 | 3 | 2 | 1,433 | 0 | $384 | $549,999 | 31 | 83 |
| 1751 68th | Long Beach | 1990 | 2 | 3 | 1,285 | 38,955 | $409 | $525,000 | 13 | 79 |
| 7221 Petrol Street | Paramount | 1989 | 2 | 2 | 829 | 84,261 | $507 | $419,900 | 53 | 78 |
| Total: 5 · Average | 2.2 | 2.2 | 1,110 | 40,593.25 | $456.8 | $495,979.4 | 76.8 | |||
| Median | 1,017 | $499,999 | ||||||||
Closed Properties (5)
Closed Comparables
| Address | City | Year | Date | BD | BTH | SqFt | LotSz | LP | SP | SP/SqFt | SP/LP | DIM | Score |
|---|---|---|---|---|---|---|---|---|---|---|---|---|---|
| 15137 Gundry Ave. | Paramount | 1980 | 07/10/2026 | 2 | 2 | 1,081 | 35,103 | $498,000 | $475,000 | $439 | 0.95 | 169 | 90 |
| 7021 Alondra Boulevard | Paramount | 1980 | 09/28/2026 | 2 | 2 | 1,180 | 1,142 | $441,500 | $420,000 | $356 | 0.95 | 96 | 90 |
| 6551 Motz | Paramount | 1992 | 07/09/2026 | 2 | 2 | 973 | 21,002 | $510,000 | $510,000 | $524 | 1.00 | 43 | 84 |
| 15351 Orange | Paramount | 1979 | 08/21/2026 | 2 | 2 | 852 | 63,435 | $429,900 | $429,900 | $505 | 1.00 | 74 | 83 |
| 6882 Alondra | Paramount | 1979 | 02/03/2026 | 2 | 2 | 1,058 | 168,206 | $479,900 | $470,000 | $444 | 0.98 | 74 | 80 |
| Total: 5 · Average | 2.0 | 2.0 | 1,028.8 | 57,777.6 | $460,980 | $460,980 | $453.6 | — | 91.2 | ||||
| Median | 1,058 | $470,000 | $470,000 | ||||||||||
Market Analysis
List vs Sale $/SqFt
Sale Price Trend
Days on Market
Sale vs List Price
AI-generated CMA
This analysis was generated automatically from MLS data. For an in-depth, human-reviewed valuation, contact Joseph Sardella at josephsardella@gmail.com.