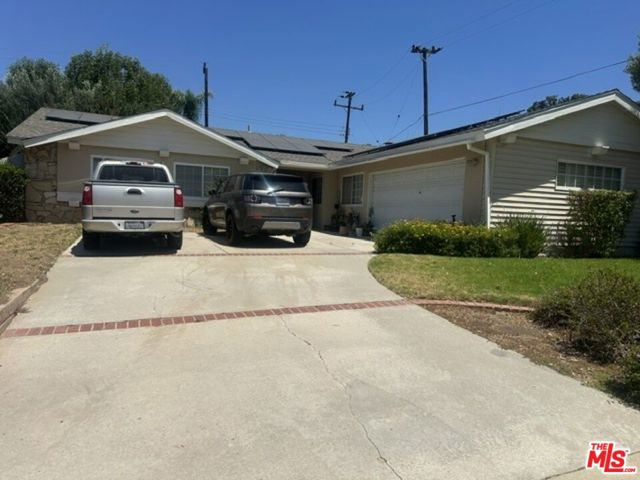
1 / 8
6733 Bernal Street, Simi Valley, CA 93063
$760K2bd · 2ba · 1,654 sqft
Lot 6,534 sqft•Single Family Residence•Active•105d on market•MLS# 00-26862267
6733 Bernal Street, Simi Valley, CA 93063
MLS# 00-26862267•Residential•Single Family Residence
Active105 days on market
$760,000
2
Beds
2
Baths
1,654
Sq Ft
6,534
Lot Sq Ft
1965
Year Built
Property Description
Great price for this Simi Valley home. Title says that the property is 4 bedrooms and 2 full bathrooms, this is actually a 2 bedroom, 1 1/2 bath home with a bonus room that the current owner is using for office space. This is the perfect starter home and the price is right! Act fast, this will not last long.
Features & Amenities
FeeBuilt 1965
Property Details
Land Type
Fee
Year Built
1965
Property Type
Residential
Property Subtype
Single Family Residence
Heating
Central
Cooling
Central Air
City
Simi Valley
Zip Code
93063
County
Ventura
Mortgage Calculator
Current Rates
$
$
%
Monthly Payment
$3,842.97
Principal & Interest
Loan Amount
$608,000
Total Interest
$775,470
Total Payment Over 30 Years
$1,383,470
This calculator provides estimates only. Actual mortgage payments may include taxes, insurance, HOA fees, and PMI. Contact a lender for accurate quotes.
Comparative Market Analysis
Residential Tier · 5 active · 5 closed
6733 Bernal Street, Simi Valley, CA 93063
Simi Valley · Single Family Residence
$760K
Residential TierBeds
2
Baths
2
Sqft
1,654
Lot
6,534 sqft
Year
1965
$/Sqft
$459
Pool: No✓
Spa: No✓
Listed 5.6% below the median closed sale of $805,000. Price per sqft ($459) is a 11% discount to closed comps ($513).
Price Position
Priced below the market — value advantage over the field.
Price advantage
Subject listed at $760K· $459/sqft
Total list price
Closed comps
vs closed median $805K
−$45K (−5.6%)
Active comps
vs active median $800K
−$40K (−5.0%)
Price per sqft
Closed compsinsufficient comp data
Active comps
vs active avg $/sqft $602
−$143 (−23.8%)
Active Properties (5)
Active Comparables
| Address | City | Year | BD | BTH | SqFt | LotSz | LP/SqFt | LP | DIM | Score |
|---|---|---|---|---|---|---|---|---|---|---|
| 1954 Ardenwood | Simi Valley | 1965 | 3 | 2 | 1,420 | 6,534 | $588 | $835,000 | 42 | 90 |
| 2392 Alscot Avenue | Simi Valley | 1972 | 4 | 2 | 1,756 | 6,534 | $456 | $799,900 | 40 | 84 |
| 6466 Hope Street | Simi Valley | 1979 | 3 | 2 | 1,297 | 7,192 | $648 | $839,900 | 95 | 81 |
| 6289 Dana Avenue | Simi Valley | 1962 | 3 | 2 | 1,110 | 7,405 | $720 | $799,000 | 18 | 80 |
| 6631 Sasparilla Dr | Simi Valley | 1995 | 3 | 2 | 1,204 | 5,227 | $598 | $719,900 | 71 | 78 |
| Total: 5 · Average | 3.2 | 2.0 | 1,357.4 | 6,578.4 | $602 | $798,740 | 53.2 | |||
| Median | 1,297 | $799,900 | ||||||||
Closed Properties (5)
Closed Comparables
| Address | City | Year | Date | BD | BTH | SqFt | LotSz | LP | SP | SP/SqFt | SP/LP | DIM | Score |
|---|---|---|---|---|---|---|---|---|---|---|---|---|---|
| 2078 Swindon | Simi Valley | 1973 | 07/21/2026 | 4 | 2 | 1,612 | 6,098 | $799,999 | $805,000 | $499 | 1.01 | 83 | 88 |
| 6664 Tapley Street | Simi Valley | 1965 | 06/05/2026 | 4 | 2 | 1,554 | 7,405 | $749,950 | $750,000 | $483 | 1.00 | 35 | 87 |
| 6452 Hazel Circle | Simi Valley | 1980 | 08/03/2026 | 3 | 2 | 1,486 | 6,969 | $839,900 | $842,500 | $567 | 1.00 | 67 | 85 |
| 2050 Cheam Avenue | Simi Valley | 1977 | 08/12/2026 | 4 | 2 | 1,736 | 6,969 | $859,000 | $850,000 | $490 | 0.99 | 80 | 84 |
| 1855 Alscot Avenue | Simi Valley | 1980 | 10/21/2026 | 3 | 2 | 1,486 | 7,840 | $799,000 | $780,000 | $525 | 0.98 | 79 | 84 |
| Total: 5 · Average | 3.6 | 2.0 | 1,574.8 | 7,056.2 | $805,500 | $805,500 | $512.8 | — | 68.8 | ||||
| Median | 1,554 | $805,000 | $805,000 | ||||||||||
Market Analysis
List vs Sale $/SqFt
Sale Price Trend
Days on Market
Sale vs List Price
AI-generated CMA
This analysis was generated automatically from MLS data. For an in-depth, human-reviewed valuation, contact Joseph Sardella at josephsardella@gmail.com.