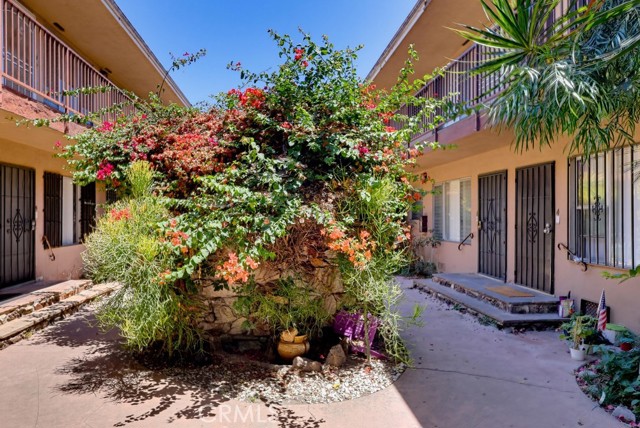
640 Elm Ave., 5, Long Beach, CA 90802
640 Elm Ave., 5, Long Beach, CA 90802
Property Description
First floor 1 bedroom (#5) Mid Century OYO in the East Village Arts District. Includes a small bonus room with a closet. Kitchen has electric cooktop and oven, with granite countertops. HOA is only $96.00 monthly, and includes water and trash. This is a Trust sale. Metro rail is one block away and bus stop is at 6th and Elm. Three blocks from Pine Street and all of its restaurants and entertainment . This must be an "All Cash" sale.
Features & Amenities
Property Details
Mortgage Calculator
Current Rates
Comparative Market Analysis
Affordable Tier · 5 active · 4 closed
Long Beach · Own Your Own
Listed 5.9% above the median closed sale of $212,500. Price per sqft ($353) is a 20% discount to closed comps ($441). Closed comps sold at 94% of list — buyers have negotiating leverage.
Price Position
Aligned with the market — fair pricing for the comps.
Active Properties (5)
Active Comparables
| Address | City | Year | BD | BTH | SqFt | LotSz | LP/SqFt | LP | DIM | Score |
|---|---|---|---|---|---|---|---|---|---|---|
| 640 Elm Ave. | Long Beach | 1959 | 1 | 1 | 662 | 15,043 | $340 | $225,000 | 12 | 99 |
| 640 Elm Ave. | Long Beach | 1959 | 1 | 1 | 639 | 15,047 | $352 | $225,000 | 98 | 98 |
| 640 Elm Avenue | Long Beach | 1959 | 1 | 1 | 642 | 0 | $350 | $225,000 | 98 | 98 |
| 640 Elm Avenue | Long Beach | 1959 | 1 | 1 | 699 | 0 | $322 | $225,000 | 98 | 96 |
| 640 Elm Avenue | Long Beach | 1959 | 1 | 1 | 703 | 15,047 | $320 | $225,000 | 98 | 96 |
| Total: 5 · Average | 1.0 | 1.0 | 669 | 15,045.667 | $336.8 | $225,000 | 80.8 | |||
| Median | 662 | $225,000 | ||||||||
Closed Properties (4)
Closed Comparables
| Address | City | Year | Date | BD | BTH | SqFt | LotSz | LP | SP | SP/SqFt | SP/LP | DIM | Score |
|---|---|---|---|---|---|---|---|---|---|---|---|---|---|
| 640 Elm Avenue | Long Beach | 1959 | 10/07/2026 | 1 | 1 | 638 | 0 | $225,000 | $210,000 | $329 | 0.93 | 73 | 100 |
| 640 Elm Avenue | Long Beach | 1959 | 05/19/2026 | 1 | 1 | 665 | 15,047 | $260,000 | $249,000 | $374 | 0.96 | 132 | 96 |
| 723 3rd | Long Beach | 1928 | 12/16/2025 | 0 | 1 | 490 | 0 | $229,000 | $210,000 | $429 | 0.92 | 85 | 73 |
| 354 Chestnut Avenue | Long Beach | 1913 | 04/07/2026 | 0 | 1 | 340 | 12,986 | $225,000 | $215,000 | $632 | 0.96 | 67 | 67 |
| Total: 4 · Average | 0.5 | 1.0 | 533.25 | 14,016.5 | $221,000 | $221,000 | $441 | — | 89.25 | ||||
| Median | 638 | $215,000 | $215,000 | ||||||||||
Market Analysis
List vs Sale $/SqFt
Sale Price Trend
Days on Market
Sale vs List Price
This analysis was generated automatically from MLS data. For an in-depth, human-reviewed valuation, contact Joseph Sardella at josephsardella@gmail.com.