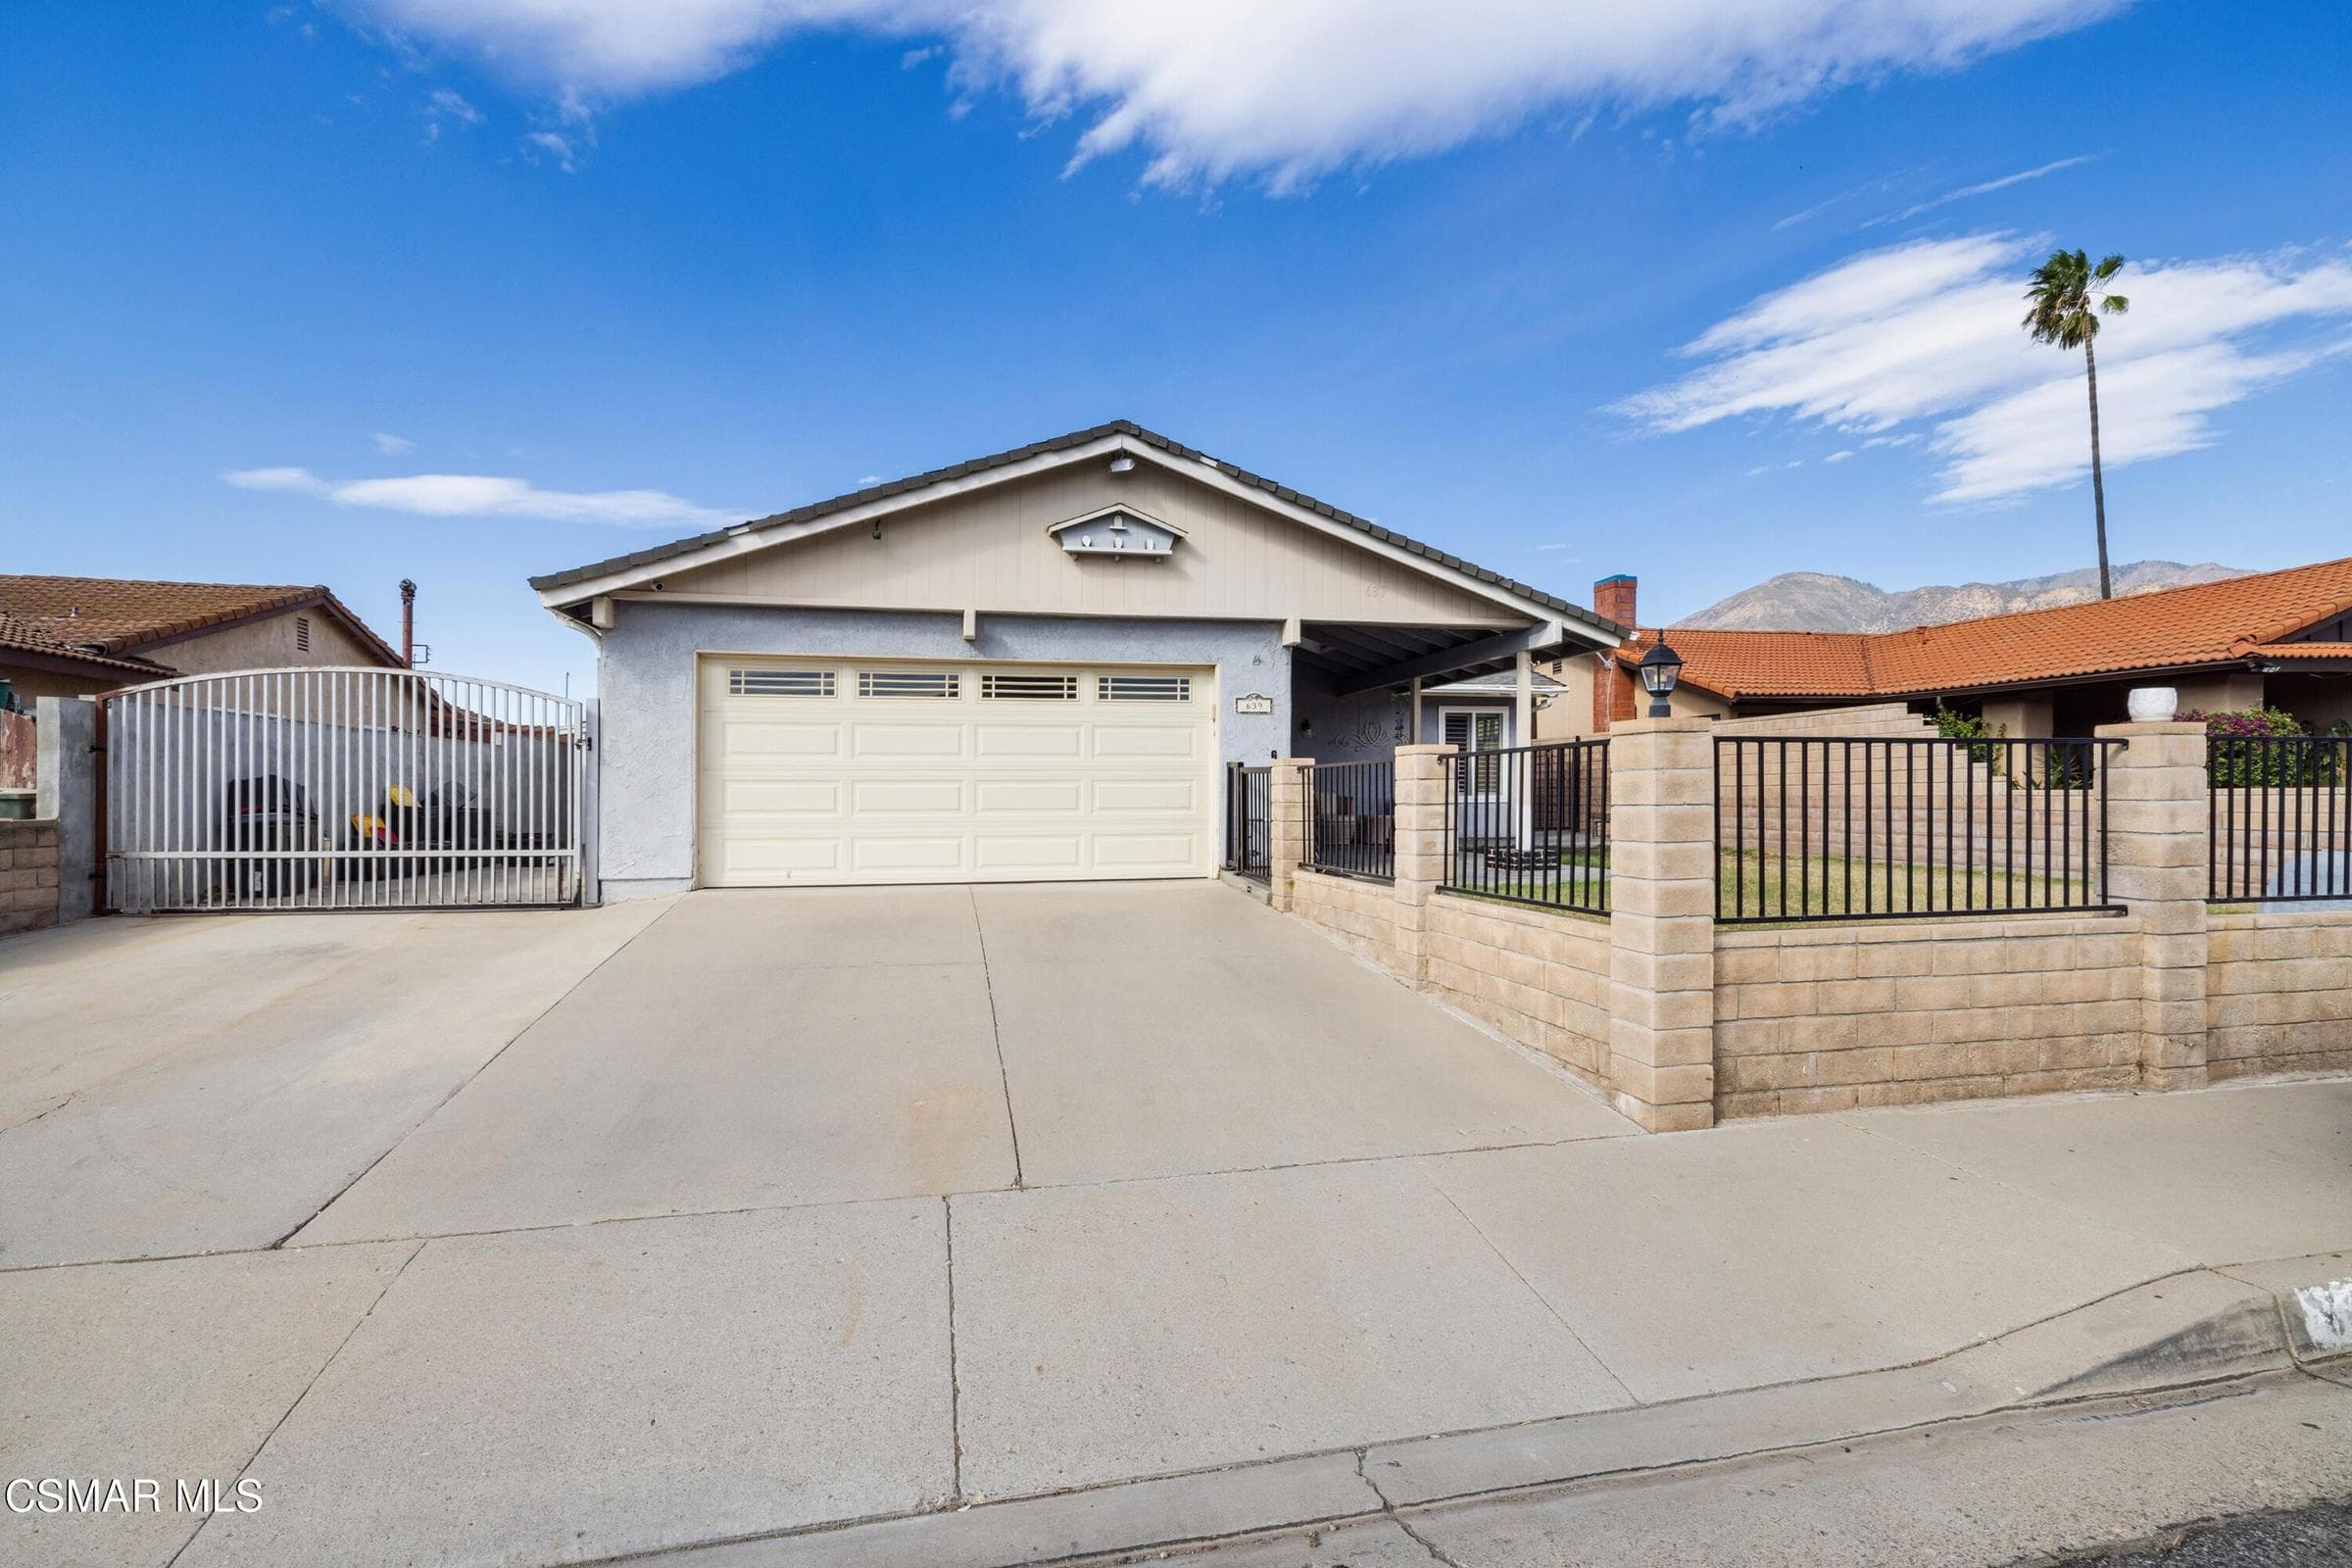
639 Chapparel Street, Fillmore, CA 93015
639 Chapparel Street, Fillmore, CA 93015
Property Description
Welcome to this inviting Fillmore home offering comfort, versatility, and exceptional indoor-outdoor living. Enjoy scenic mountain views and a spacious floor plan featuring two primary suites, providing flexibility for guests, extended family, or multi-generational living. The primary suite also offers the potential to create an ADU, presenting an exciting opportunity for additional living space or a private area for extended family (buyer to verify feasibility, permits, and requirements). The entertainer's backyard is a standout, featuring a built-in gas BBQ, sink, and refrigerator, stamped concrete, and a covered patio that provides plenty of shade for outdoor dining and gatherings. Plantation shutters throughout add a timeless touch while enhancing privacy and light control. Whether relaxing at home or hosting friends and family, this property offers a wonderful setting to enjoy the beautiful surroundings. Conveniently located near schools, shopping, dining, parks, and commuter routes, this home combines versatility, comfort, and convenience.
Features & Amenities
Property Details
Mortgage Calculator
Current Rates
Comparative Market Analysis
Residential Tier · 5 active · 5 closed
Fillmore · Single Family Residence
Listed 7.4% above the median closed sale of $759,000. Closed comps sold at 100% of list — strong seller's market.
Price Position
Positioned above the market — commands a premium.
Active Properties (5)
Active Comparables
| Address | City | Year | BD | BTH | SqFt | LotSz | LP/SqFt | LP | DIM | Score |
|---|---|---|---|---|---|---|---|---|---|---|
| 222 2nd | Fillmore | 1967 | 3 | 2 | 1,768 | 7,838 | $441 | $780,000 | 25 | 82 |
| 1034 Candelaria Lane | Fillmore | 2003 | 3 | 3 | 2,258 | 5,995 | $389 | $879,000 | 3 | 76 |
| 1134 Shadow Ridge Way | Fillmore | 2026 | 4 | 3 | 1,859 | 5,000 | $390 | $724,990 | 4 | 75 |
| 551 Stonehedge Drive | Fillmore | 1981 | 4 | 5 | 2,864 | 8,320 | $307 | $879,000 | 11 | 72 |
| 379 Foothill Drive | Fillmore | 1965 | 4 | 3 | 2,444 | 10,890 | $368 | $899,000 | 138 | 72 |
| Total: 5 · Average | 3.6 | 3.2 | 2,238.6 | 7,608.6 | $379 | $832,398 | 36.2 | |||
| Median | 2,258 | $879,000 | ||||||||
Closed Properties (5)
Closed Comparables
| Address | City | Year | Date | BD | BTH | SqFt | LotSz | LP | SP | SP/SqFt | SP/LP | DIM | Score |
|---|---|---|---|---|---|---|---|---|---|---|---|---|---|
| 984 Meadowlark Drive | Fillmore | 1993 | 08/28/2026 | 3 | 3 | 2,071 | 6,148 | $785,000 | $785,000 | $379 | 1.00 | 9 | 88 |
| 947 Meadowlark Drive | Fillmore | 1992 | 04/27/2026 | 5 | 3 | 2,010 | 5,096 | $745,000 | $770,000 | $383 | 1.03 | 32 | 85 |
| 936 Hinckley Lane | Fillmore | 2001 | 10/28/2026 | 3 | 3 | 2,114 | 4,356 | $759,000 | $759,000 | $359 | 1.00 | 97 | 83 |
| 1028 Meadowlark Drive | Fillmore | 1994 | 12/12/2025 | 3 | 3 | 2,071 | 6,185 | $759,000 | $745,000 | $360 | 0.98 | 203 | 83 |
| 803 Sespe Avenue | Fillmore | 1971 | 11/21/2025 | 4 | 2 | 1,541 | 6,534 | $739,900 | $730,000 | $474 | 0.99 | 94 | 83 |
| Total: 5 · Average | 3.6 | 2.8 | 1,961.4 | 5,663.8 | $757,800 | $757,800 | $391 | — | 87 | ||||
| Median | 2,071 | $759,000 | $759,000 | ||||||||||
Market Analysis
List vs Sale $/SqFt
Sale Price Trend
Days on Market
Sale vs List Price
This analysis was generated automatically from MLS data. For an in-depth, human-reviewed valuation, contact Joseph Sardella at josephsardella@gmail.com.