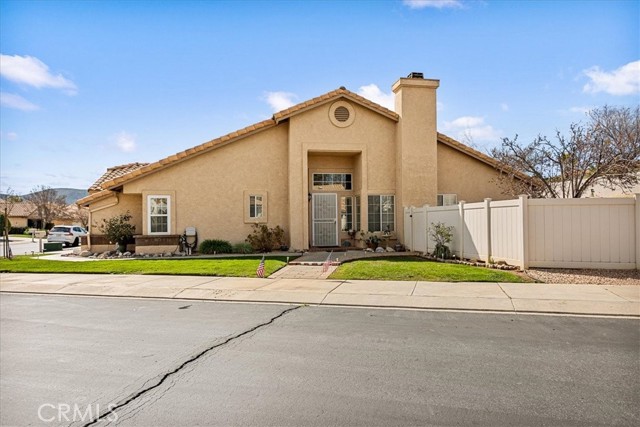
625 South Shinecock, Banning, CA 92220
625 South Shinecock, Banning, CA 92220
Property Description
Welcome to Sun Lakes Community, a premier senior 55+ community known for its renowned private golf courses and outstanding amenities designed for an active lifestyle. Nestled on a spacious corner lot, this inviting 3 bedroom, 2 bathroom home offers soaring ceilings, a warm and welcoming fireplace, and a bright kitchen with an eat in area that opens to the backyard, filling the space with natural light. Step outside to a private backyard oasis featuring a lovely garden area and covered patio, ideal for peaceful mornings or evening gatherings. Residents of Sun Lakes enjoy an exceptional array of amenities including a restaurants, lakes, pools, fitness center, games, and much more. Discover the comfort, community, and lifestyle that make this home a wonderful place to call your own.
Features & Amenities
Property Details
Mortgage Calculator
Current Rates
Comparative Market Analysis
Affordable Tier · 5 active · 5 closed
Banning · Single Family Residence
Listed 4.7% above the median closed sale of $323,750. Expect a longer timeline — comps averaged 125 days on market.
Price Position
Aligned with the market — fair pricing for the comps.
Active Properties (5)
Active Comparables
| Address | City | Year | BD | BTH | SqFt | LotSz | LP/SqFt | LP | DIM | Score |
|---|---|---|---|---|---|---|---|---|---|---|
| 5870 Oakmont | Banning | 1989 | 3 | 2 | 1,315 | 4,792 | $273 | $359,000 | 4 | 93 |
| 1107 Pauma Valley | Banning | 1988 | 3 | 2 | 1,298 | 6,098 | $239 | $310,000 | 11 | 93 |
| 1291 Cypress Point | Banning | 1995 | 3 | 2 | 1,254 | 4,356 | $278 | $349,000 | 72 | 93 |
| 607 Indian Wells Road | Banning | 1989 | 2 | 2 | 1,452 | 5,663 | $231 | $335,000 | 38 | 88 |
| 5839 Riviera Avenue | Banning | 1989 | 2 | 3 | 1,452 | 6,969 | $238 | $345,000 | 4 | 87 |
| Total: 5 · Average | 2.6 | 2.2 | 1,354.2 | 5,575.6 | $251.8 | $339,600 | 25.8 | |||
| Median | 1,315 | $345,000 | ||||||||
Closed Properties (5)
Closed Comparables
| Address | City | Year | Date | BD | BTH | SqFt | LotSz | LP | SP | SP/SqFt | SP/LP | DIM | Score |
|---|---|---|---|---|---|---|---|---|---|---|---|---|---|
| 813 Cypress Point | Banning | 1989 | 06/04/2026 | 3 | 2 | 1,285 | 6,098 | $355,000 | $355,000 | $276 | 1.00 | 108 | 93 |
| 909 Pauma Valley | Banning | 1988 | 10/23/2026 | 3 | 2 | 1,161 | 4,792 | $315,000 | $323,750 | $279 | 1.03 | 124 | 93 |
| 832 Pine Valley | Banning | 1989 | 09/10/2026 | 3 | 2 | 1,195 | 3,920 | $349,500 | $333,000 | $279 | 0.95 | 37 | 92 |
| 5912 Brookside | Banning | 1987 | 07/08/2026 | 3 | 2 | 1,312 | 5,663 | $309,000 | $310,000 | $236 | 1.00 | 96 | 91 |
| 6351 Spyglass | Banning | 1989 | 06/24/2026 | 3 | 2 | 1,195 | 4,792 | $307,000 | $307,000 | $257 | 1.00 | 261 | 91 |
| Total: 5 · Average | 3.0 | 2.0 | 1,229.6 | 5,053 | $325,750 | $325,750 | $265.4 | — | 125.2 | ||||
| Median | 1,195 | $323,750 | $323,750 | ||||||||||
Market Analysis
List vs Sale $/SqFt
Sale Price Trend
Days on Market
Sale vs List Price
This analysis was generated automatically from MLS data. For an in-depth, human-reviewed valuation, contact Joseph Sardella at josephsardella@gmail.com.