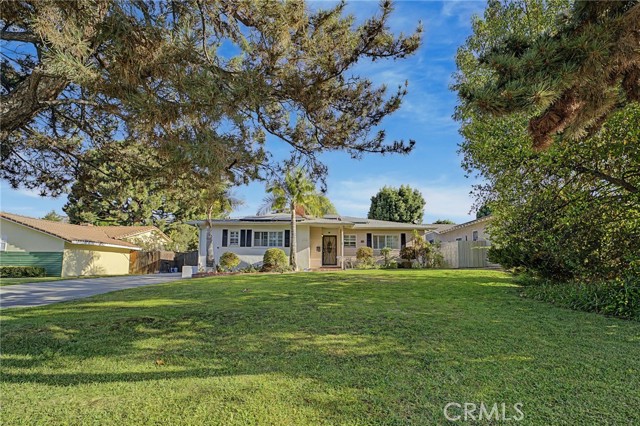
621 East Cypress Avenue, Glendora, CA 91741
621 East Cypress Avenue, Glendora, CA 91741
Property Description
Welcome to this spacious 4 bedroom, 3 bathroom home located in desirable North Glendora within the award-winning Glendora Unified School District. The home offers a comfortable and functional floor plan with spacious living and dining areas, a generously sized kitchen, and plenty of natural light throughout. Step outside to a private backyard featuring a sparkling pool and large covered patio, perfect for entertaining, relaxing, and enjoying Southern California living. An additional pool room located off the garage includes its own attached bathroom and offers great flexibility as a guest space, home office, pool house, or potential Junior ADU with the possibility to expand and create additional living space. With a generous lot, versatile bonus space, pool, and a sought-after North Glendora location close to schools, shopping, dining, parks, and more, this home offers plenty of opportunity to make it your own.
Features & Amenities
Property Details
Mortgage Calculator
Current Rates
Comparative Market Analysis
Residential Tier · 5 active · 5 closed
Glendora · Single Family Residence
Listed 4.4% below the median closed sale of $1,149,000.
Price Position
Aligned with the market — fair pricing for the comps.
Active Properties (5)
Active Comparables
| Address | City | Year | BD | BTH | SqFt | LotSz | LP/SqFt | LP | DIM | Score |
|---|---|---|---|---|---|---|---|---|---|---|
| 611 Foothill Blvd | Glendora | 1951 | 4 | 3 | 2,234 | 10,132 | $552 | $1.23M | 27 | 93 |
| 801 Dalton | Glendora | 1953 | 3 | 2 | 1,885 | 9,444 | $530 | $999,000 | 6 | 91 |
| 543 Comstock | Glendora | 1953 | 3 | 2 | 1,842 | 11,119 | $556 | $1.02M | 89 | 89 |
| 717 Laurel Avenue | Glendora | 1959 | 3 | 2 | 1,894 | 9,145 | $596 | $1.13M | 61 | 79 |
| 883 Leadora | Glendora | 1954 | 3 | 4 | 1,673 | 8,589 | $597 | $998,000 | 79 | 75 |
| Total: 5 · Average | 3.2 | 2.6 | 1,905.6 | 9,685.8 | $566.2 | $1.08M | 52.4 | |||
| Median | 1,885 | $1.02M | ||||||||
Closed Properties (5)
Closed Comparables
| Address | City | Year | Date | BD | BTH | SqFt | LotSz | LP | SP | SP/SqFt | SP/LP | DIM | Score |
|---|---|---|---|---|---|---|---|---|---|---|---|---|---|
| 711 Cypress | Glendora | 1962 | 08/12/2026 | 4 | 2 | 1,912 | 9,139 | $989,000 | $989,000 | $517 | 1.00 | 28 | 93 |
| 543 Glenwood Avenue | Glendora | 1955 | 04/17/2026 | 3 | 3 | 1,638 | 9,138 | $1.15M | $1.15M | $701 | 1.00 | 23 | 87 |
| 772 Northridge | Glendora | 1954 | 01/15/2026 | 3 | 2 | 2,213 | 9,982 | $1.15M | $1.15M | $520 | 1.00 | 63 | 84 |
| 827 Dalton Avenue | Glendora | 1958 | 11/19/2025 | 3 | 2 | 1,676 | 9,670 | $975,000 | $975,000 | $582 | 1.00 | 101 | 83 |
| 522 Carroll | Glendora | 1956 | 11/07/2025 | 3 | 3 | 2,480 | 10,264 | $1.25M | $1.25M | $502 | 1.00 | 36 | 82 |
| Total: 5 · Average | 3.2 | 2.4 | 1,983.8 | 9,638.6 | $1.10M | $1.10M | $564.4 | — | 50.2 | ||||
| Median | 1,912 | $1.15M | $1.15M | ||||||||||
Market Analysis
List vs Sale $/SqFt
Sale Price Trend
Days on Market
Sale vs List Price
This analysis was generated automatically from MLS data. For an in-depth, human-reviewed valuation, contact Joseph Sardella at josephsardella@gmail.com.