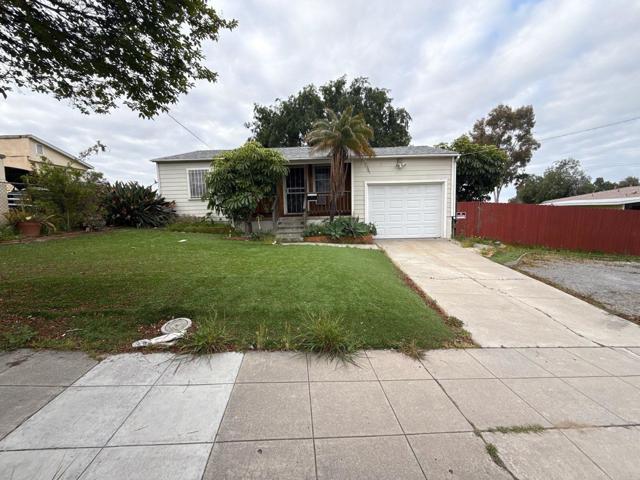
1 / 29
6119 Broadway, San Diego, CA 92114
$1.10M3bd · 2ba · 1,130 sqft
Lot 0 sqft•Single Family Residence•Active•68d on market•MLS# 8N-2608050
6119 Broadway, San Diego, CA 92114
MLS# 8N-2608050•Residential•Single Family Residence
Active68 days on market
$1,099,000
3
Beds
2
Baths
1,130
Sq Ft
0
Lot Sq Ft
1952
Year Built
None
View
Property Description
Developers, Investors, Builders, Everyone, amazing opportunity to add value, with existing single family residence and plans ready to issue to build 12 new units (a mix of 2 bed and 1 bedroom units). Amazing rental upside. Start construction day 1.
Features & Amenities
FeeBuilt 1952
Property Details
Land Type
Fee
Year Built
1952
Property Type
Residential
Property Subtype
Single Family Residence
Parking Spaces
1
Garage Spaces
1
Cooling
None
View
None
City
San Diego
Zip Code
92114
County
San Diego
Mortgage Calculator
Current Rates
$
$
%
Monthly Payment
$5,557.14
Principal & Interest
Loan Amount
$879,200
Total Interest
$1,121,371
Total Payment Over 30 Years
$2,000,571
This calculator provides estimates only. Actual mortgage payments may include taxes, insurance, HOA fees, and PMI. Contact a lender for accurate quotes.
Comparative Market Analysis
Affordable Tier · 5 active · 5 closed
6119 Broadway, San Diego, CA 92114
San Diego · Single Family Residence
$1.10M
Affordable TierBeds
3
Baths
2
Sqft
1,130
Lot
0 sqft
Year
1952
$/Sqft
$973
Pool: No✓
Spa: No✓
View: None✓
Garage: 1-car✓
Listed 6.7% above the median closed sale of $1,030,000. Price per sqft ($973) is a 42% premium to closed comps ($683). Closed comps sold at 102% of list — strong seller's market.
Price Position
Positioned above the market — commands a premium.
Premium
Subject listed at $1.10M· $973/sqft
Total list price
Closed comps
vs closed median $1.03M
+$69K (+6.7%)
Active comps
vs active median $950K
+$149K (+15.7%)
Price per sqft
Closed compsinsufficient comp data
Active comps
vs active avg $/sqft $453
+$520 (+115.0%)
Active Properties (5)
Active Comparables
| Address | City | Year | BD | BTH | SqFt | LotSz | LP/SqFt | LP | DIM | Score |
|---|---|---|---|---|---|---|---|---|---|---|
| 1315 Darby Street | Spring Valley | 1990 | 3 | 2 | 1,620 | 7,841 | $586 | $950,000 | 3 | 57 |
| 2334 Division Street | National City | 1962 | 4 | 3 | 1,888 | 5,700 | $503 | $949,000 | 32 | 55 |
| 1219 Wren Street | San Diego | 1961 | 5 | 4 | 2,987 | 33,541 | $335 | $999,999 | 2 | 50 |
| 5206 La Paz Drive | San Diego | 1952 | 6 | 3 | 2,811 | 6,970 | $391 | $1.10M | 20 | 49 |
| 7302 Canyon View Lane | Lemon Grove | 1997 | 4 | 3 | 2,120 | 6,094 | $448 | $950,000 | 26 | 47 |
| Total: 5 · Average | 4.4 | 3.0 | 2,285.2 | 12,029.2 | $452.6 | $989,799.8 | 16.6 | |||
| Median | 2,120 | $950,000 | ||||||||
Closed Properties (5)
Closed Comparables
| Address | City | Year | Date | BD | BTH | SqFt | LotSz | LP | SP | SP/SqFt | SP/LP | DIM | Score |
|---|---|---|---|---|---|---|---|---|---|---|---|---|---|
| 1147 10th | Santa Ana | 1954 | 07/01/2026 | 3 | 2 | 1,513 | 7,735 | $1.15M | $1.18M | $777 | 1.02 | 36 | 63 |
| 4365 Aragon Way | San Diego | 1944 | 07/02/2026 | 3 | 2 | 1,487 | 13,491 | $1.10M | $1.06M | $716 | 0.97 | 49 | 62 |
| 6837 Celia Vista Drive | San Diego | 1957 | 02/04/2026 | 3 | 3 | 1,412 | 6,098 | $1.03M | $1.03M | $729 | 1.00 | 22 | 62 |
| 6145 Carling Way | San Diego | 1956 | 05/26/2026 | 3 | 2 | 1,593 | 7,100 | $1.05M | $1.01M | $634 | 0.96 | 47 | 60 |
| 1904 Gateway Drive | San Diego | 1956 | 10/28/2026 | 4 | 2 | 1,740 | 6,398 | $849,900 | $975,000 | $560 | 1.15 | 36 | 59 |
| Total: 5 · Average | 3.2 | 2.2 | 1,549 | 8,164.4 | $1.05M | $1.05M | $683.2 | — | 38 | ||||
| Median | 1,513 | $1.03M | $1.03M | ||||||||||
Market Analysis
List vs Sale $/SqFt
Sale Price Trend
Days on Market
Sale vs List Price
AI-generated CMA
This analysis was generated automatically from MLS data. For an in-depth, human-reviewed valuation, contact Joseph Sardella at josephsardella@gmail.com.