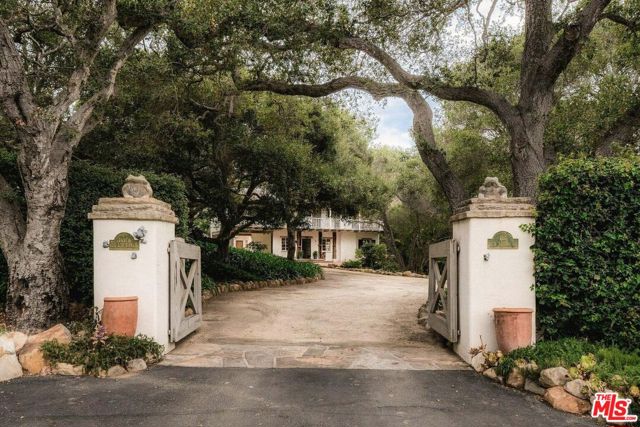
1 / 15
605 San Ysidro Road, Santa Barbara, CA 93108
$6.8M4bd · 4ba · 3,405 sqft
Lot 45,738 sqft•Single Family Residence•Active•31d on market•MLS# 00-26995223
605 San Ysidro Road, Santa Barbara, CA 93108
MLS# 00-26995223•Residential•Single Family Residence
Active31 days on market
$6,800,000
4
Beds
4
Baths
3,405
Sq Ft
45,738
Lot Sq Ft
1920
Year Built
Mountain(s)
View
Features & Amenities
FeeBuilt 1920
Property Details
Land Type
Fee
Year Built
1920
Property Type
Residential
Property Subtype
Single Family Residence
Heating
Fireplace(s)
Cooling
See Remarks
View
Mountain(s)
Flooring
Wood
City
Santa Barbara
Zip Code
93108
County
Santa Barbara
Mortgage Calculator
Current Rates
$
$
%
Monthly Payment
$34,384.50
Principal & Interest
Loan Amount
$5,440,000
Total Interest
$6,938,420
Total Payment Over 30 Years
$12,378,420
This calculator provides estimates only. Actual mortgage payments may include taxes, insurance, HOA fees, and PMI. Contact a lender for accurate quotes.
Comparative Market Analysis
Luxury Tier · 5 active · 4 closed
605 San Ysidro Road, Santa Barbara, CA 93108
Santa Barbara · Single Family Residence
$6.8M
Luxury TierBeds
4
Baths
4
Sqft
3,405
Lot
1.05 ac
Year
1920
$/Sqft
$1997
Pool: No✓
Spa: No✓
View: mountain✓
Listed in line with the median closed sale of $6,946,500. Price per sqft ($1,997) is a 18% premium to closed comps ($1,698). Closed comps sold at 93% of list — buyers have negotiating leverage. Expect a longer timeline — comps averaged 193 days on market. Luxury tier — fewer comparable sales widen the confidence range.
Price Position
Aligned with the market — fair pricing for the comps.
At market
Subject listed at $6.80M· $1,997/sqft
Total list price
Closed comps
vs closed median $7.00M
−$200K (−2.9%)
Active comps
vs active median $7.30M
−$499K (−6.8%)
Price per sqft
Closed compsinsufficient comp data
Active comps
vs active avg $/sqft $2,500
−$503 (−20.1%)
Active Properties (5)
Active Comparables
| Address | City | Year | BD | BTH | SqFt | LotSz | LP/SqFt | LP | DIM | Score |
|---|---|---|---|---|---|---|---|---|---|---|
| 279 Santa Rosa Lane | Montecito | 1948 | 4 | 4 | 3,307 | 37,897 | $1,813 | $6.00M | 159 | 82 |
| 1157 Glenview Road | Montecito | 1980 | 4 | 4 | 4,179 | 43,996 | $1,423 | $5.95M | 99 | 67 |
| 540 El Bosque Road | Santa Barbara | 1913 | 5 | 4 | 0 | 24,018 | $0 | $7.30M | 12 | 65 |
| 195 Sheffield Drive | Montecito | 1991 | 4 | 5 | 4,074 | 37,897 | $1,864 | $7.59M | 34 | 60 |
| 1508 Miramar | Santa Barbara | 1957 | 2 | 4 | 1,550 | 1,742 | $4,900 | $7.59M | 53 | 37 |
| Total: 5 · Average | 3.8 | 4.2 | 3,277.5 | 29,110 | $2,500 | $6.89M | 71.4 | |||
| Median | 4,074 | $7.30M | ||||||||
Closed Properties (4)
Closed Comparables
| Address | City | Year | Date | BD | BTH | SqFt | LotSz | LP | SP | SP/SqFt | SP/LP | DIM | Score |
|---|---|---|---|---|---|---|---|---|---|---|---|---|---|
| 1071 Mountain Drive | Santa Barbara | 1954 | 08/28/2026 | 4 | 4 | 3,876 | 57,935 | $7.30M | $7.00M | $1,806 | 0.96 | 71 | 79 |
| 1399 School House Road | Santa Barbara | 1992 | 12/04/2025 | 5 | 5 | 3,637 | 40,511 | $6.95M | $6.63M | $1,822 | 0.95 | 152 | 69 |
| 2010 Birnam Wood Drive | Santa Barbara | 1991 | 06/09/2026 | 4 | 6 | 4,166 | 21,344 | $7.45M | $6.89M | $1,655 | 0.93 | 106 | 67 |
| 526 Crocker Sperry Drive | Montecito | 1981 | 10/16/2026 | 4 | 6 | 5,041 | 56,628 | $8.50M | $7.62M | $1,511 | 0.90 | 444 | 55 |
| Total: 4 · Average | 4.3 | 5.3 | 4,180 | 44,104.5 | $7.03M | $7.03M | $1,698.5 | — | 193.25 | ||||
| Median | 4,166 | $7.00M | $7.00M | ||||||||||
Market Analysis
List vs Sale $/SqFt
Sale Price Trend
Days on Market
Sale vs List Price
AI-generated CMA
This analysis was generated automatically from MLS data. For an in-depth, human-reviewed valuation, contact Joseph Sardella at josephsardella@gmail.com.