1 / 35
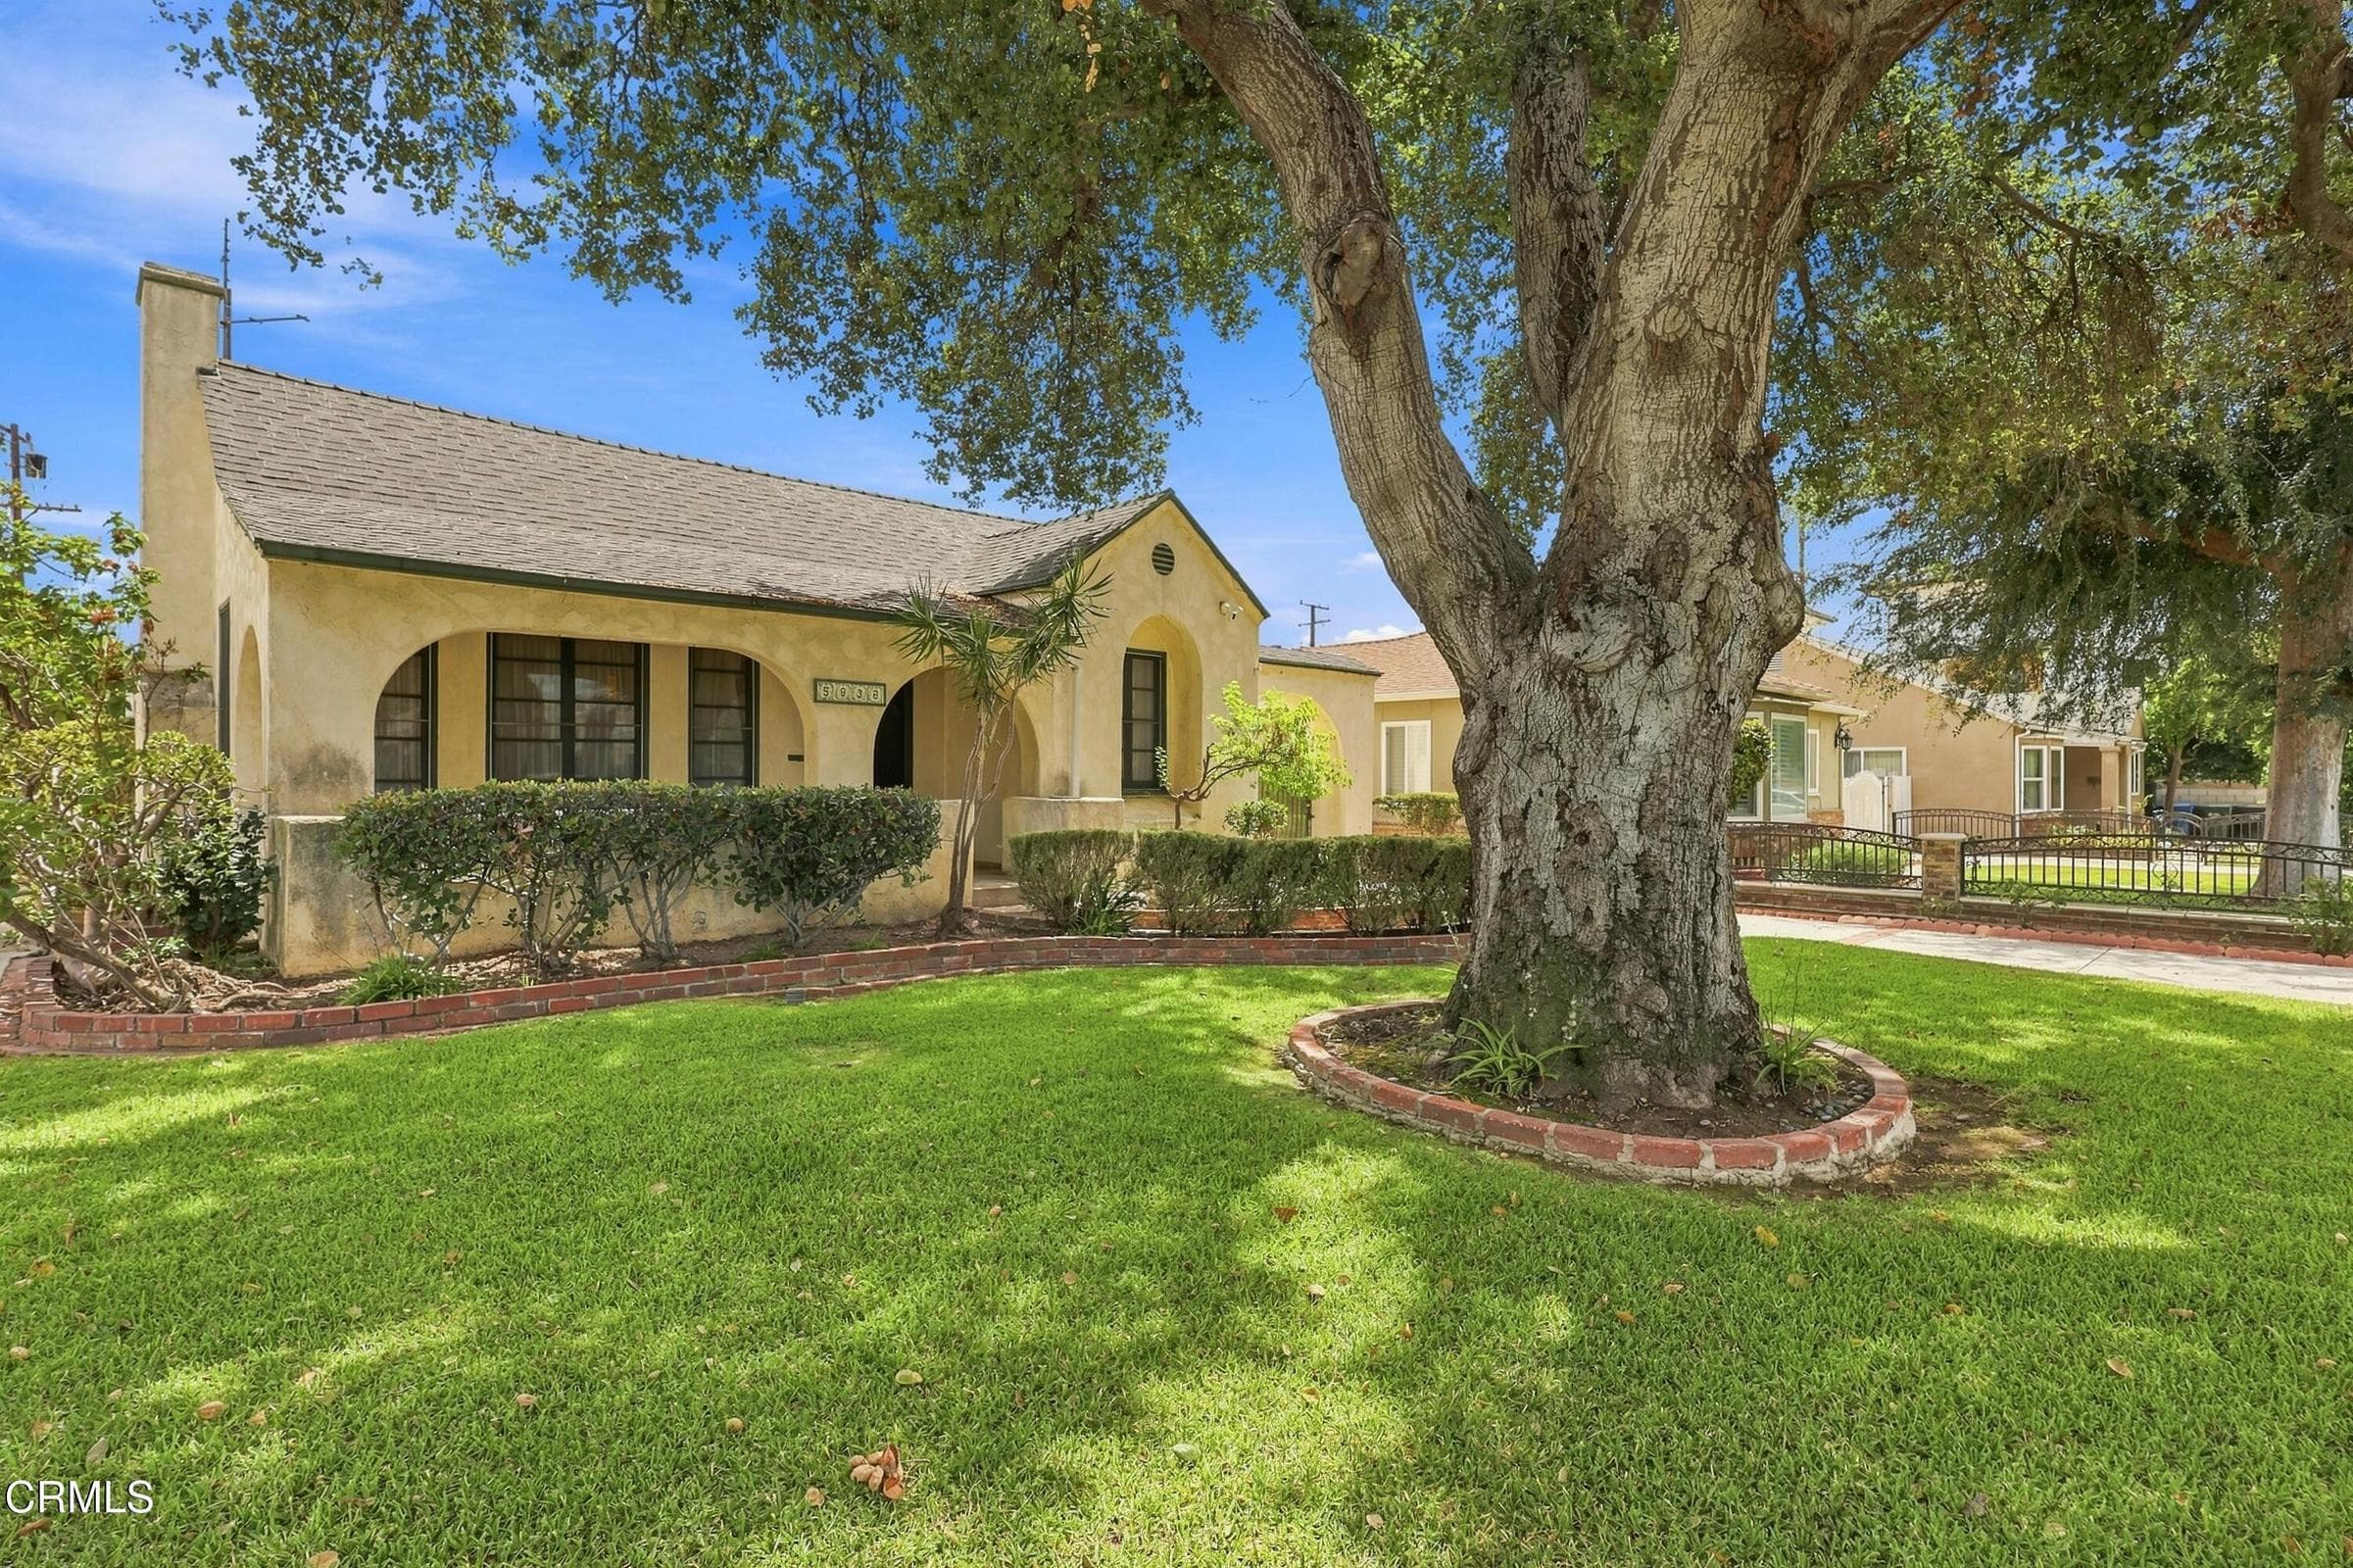
5936 Encinita Avenue, Temple City, CA 91780
$1.40M4bd · 3ba · 1,890 sqft
Lot 8,564 sqft•Single Family Residence•Active•75d on market•MLS# P1-28528
5936 Encinita Avenue, Temple City, CA 91780
MLS# P1-28528•Residential•Single Family Residence
Active75 days on market
$1,398,000
4
Beds
3
Baths
1,890
Sq Ft
8,564
Lot Sq Ft
1932
Year Built
None
View
Property Description
Temple City Schools, 10 out of 10 rating. Close to restaurants, Las Tunas, & Schools. 3 bedrooms and 3 baths plus an ADU for additional rental income. It also has an inground pool. Willing to negotiate.
Features & Amenities
FeeBuilt 1932
Property Details
Land Type
Fee
Year Built
1932
Property Type
Residential
Property Subtype
Single Family Residence
Parking Spaces
4
Garage Spaces
2
Heating
Forced Air
Cooling
Central Air
View
None
Flooring
Wood
City
Temple City
Zip Code
91780
County
Los Angeles
Mortgage Calculator
Current Rates
$
$
%
Monthly Payment
$7,069.05
Principal & Interest
Loan Amount
$1,118,400
Total Interest
$1,426,458
Total Payment Over 30 Years
$2,544,858
This calculator provides estimates only. Actual mortgage payments may include taxes, insurance, HOA fees, and PMI. Contact a lender for accurate quotes.
Comparative Market Analysis
Residential Tier · 5 active · 5 closed
5936 Encinita Avenue, Temple City, CA 91780
Temple City · Single Family Residence
$1.40M
Residential TierBeds
4
Baths
3
Sqft
1,890
Lot
8,564 sqft
Year
1932
$/Sqft
$740
Pool: Yes✓
Spa: Yes✓
View: None✓
Garage: 2-car✓
Listed 12.6% above the median closed sale of $1,242,000. Closed comps sold at 101% of list — strong seller's market.
Price Position
Positioned above the market — commands a premium.
Premium
Subject listed at $1.40M· $740/sqft
Total list price
Closed comps
vs closed median $1.24M
+$156K (+12.6%)
Active comps
vs active median $1.35M
+$48K (+3.6%)
Price per sqft
Closed compsinsufficient comp data
Active comps
vs active avg $/sqft $818
−$78 (−9.5%)
Active Properties (5)
Active Comparables
| Address | City | Year | BD | BTH | SqFt | LotSz | LP/SqFt | LP | DIM | Score |
|---|---|---|---|---|---|---|---|---|---|---|
| 8865 Camino Real | San Gabriel | 1948 | 3 | 2 | 1,632 | 8,784 | $838 | $1.37M | 40 | 78 |
| 5452 Loma | Temple City | 1946 | 5 | 3 | 1,870 | 7,662 | $722 | $1.35M | 33 | 75 |
| 9715 Lemon Avenue | Arcadia | 1914 | 3 | 2 | 1,568 | 5,310 | $828 | $1.30M | 67 | 74 |
| 5935 Kauffman Ave. | Temple City | 2026 | 3 | 3 | 1,811 | 8,750 | $707 | $1.28M | 3 | 73 |
| 9416 Broadway | Temple City | 1951 | 3 | 2 | 1,359 | 13,046 | $993 | $1.35M | 159 | 72 |
| Total: 5 · Average | 3.4 | 2.4 | 1,648 | 8,710.4 | $817.6 | $1.33M | 60.4 | |||
| Median | 1,632 | $1.35M | ||||||||
Closed Properties (5)
Closed Comparables
| Address | City | Year | Date | BD | BTH | SqFt | LotSz | LP | SP | SP/SqFt | SP/LP | DIM | Score |
|---|---|---|---|---|---|---|---|---|---|---|---|---|---|
| 6153 Oak Avenue | Temple City | 1953 | 08/07/2026 | 3 | 2 | 1,662 | 7,504 | $1.20M | $1.26M | $757 | 1.05 | 59 | 82 |
| 6037 Oak | Temple City | 1940 | 12/19/2025 | 3 | 2 | 1,143 | 9,261 | $1.30M | $1.20M | $1,050 | 0.92 | 61 | 66 |
| 5521 Loma | Temple City | 1960 | 05/19/2026 | 3 | 2 | 1,565 | 10,757 | $1.25M | $1.24M | $794 | 0.99 | 28 | 65 |
| 9168 Wedgewood Lane | Temple City | 1953 | 02/23/2026 | 5 | 3 | 2,602 | 8,981 | $1.30M | $1.31M | $503 | 1.01 | 45 | 65 |
| 5716 Alessandro | Temple City | 1940 | 12/05/2025 | 2 | 1 | 1,308 | 9,135 | $1.13M | $1.20M | $917 | 1.06 | 50 | 63 |
| Total: 5 · Average | 3.2 | 2.0 | 1,656 | 9,127.6 | $1.24M | $1.24M | $804.2 | — | 48.6 | ||||
| Median | 1,565 | $1.24M | $1.24M | ||||||||||
Market Analysis
List vs Sale $/SqFt
Sale Price Trend
Days on Market
Sale vs List Price
AI-generated CMA
This analysis was generated automatically from MLS data. For an in-depth, human-reviewed valuation, contact Joseph Sardella at josephsardella@gmail.com.