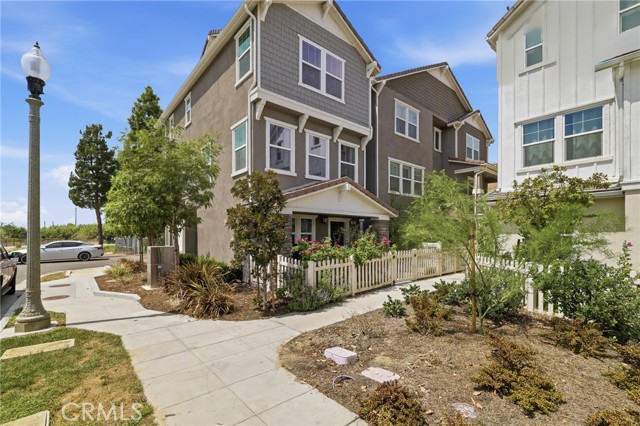
591 Heritage Valley Parkway, Fillmore, CA 93015
591 Heritage Valley Parkway, Fillmore, CA 93015
Property Description
Energy independence, documented: Owned solar with upgraded grid-forming micro-inverters plus a Tesla Powerwall 3 wired for whole-home backup. The power stays on when the neighborhood goes dark. Total electric cost: approximately $30/month in fixed utility fees only, with energy charges zeroed out by the system (seller's actual SCE bills available upon request). Dual-zone AC, tankless water heater, and energy-efficient appliances throughout keep it that way. Thoughtfully upgraded: Owned alkaline water filtration at the kitchen sink and refrigerator, home plumbed for soft-water service with multiple local providers available, video doorbell and automated kitchen shades included (no subscriptions required), CAT6 network wiring in every room, recessed lighting throughout, and an EV-charger-ready garage. Bike trail directly across the street, community pool one block away, low HOA - and no Mello-Roos with panoramic Mountain View’s.
Features & Amenities
Property Details
Mortgage Calculator
Current Rates
Comparative Market Analysis
Residential Tier · 4 active · 3 closed
Fillmore · Townhouse
Listed in line with the median closed sale of $615,000.
Price Position
Aligned with the market — fair pricing for the comps.
Active Properties (4)
Active Comparables
| Address | City | Year | BD | BTH | SqFt | LotSz | LP/SqFt | LP | DIM | Score |
|---|---|---|---|---|---|---|---|---|---|---|
| 519 Coconut Lane | Fillmore | 2021 | 3 | 3 | 1,869 | 1,047 | $326 | $610,000 | 49 | 82 |
| 512 Mulberry Lane | Fillmore | 2021 | 3 | 3 | 1,942 | 1,137 | $322 | $625,000 | 25 | 81 |
| 155 Rosewood Street | Fillmore | 2016 | 4 | 3 | 1,742 | 1,742 | $356 | $620,000 | 110 | 79 |
| 173 Rosewood | Fillmore | 2016 | 3 | 3 | 1,534 | 1,534 | $401 | $615,000 | 31 | 73 |
| Total: 4 · Average | 3.3 | 3.0 | 1,771.75 | 1,365 | $351.25 | $617,500 | 53.75 | |||
| Median | 1,869 | $620,000 | ||||||||
Closed Properties (3)
Closed Comparables
| Address | City | Year | Date | BD | BTH | SqFt | LotSz | LP | SP | SP/SqFt | SP/LP | DIM | Score |
|---|---|---|---|---|---|---|---|---|---|---|---|---|---|
| 595 Heritage Valley | Fillmore | 2022 | 11/20/2025 | 3 | 3 | 1,740 | 984 | $615,000 | $615,000 | $353 | 1.00 | 71 | 84 |
| 534 Mulberry Lane | Fillmore | 2021 | 06/05/2026 | 3 | 3 | 1,938 | 1,138 | $610,000 | $610,000 | $315 | 1.00 | 71 | 83 |
| 549 Heritage Parkway | Fillmore | 2021 | 04/20/2026 | 3 | 3 | 2,156 | 1,752 | $625,000 | $625,000 | $290 | 1.00 | 53 | 73 |
| Total: 3 · Average | 3.0 | 3.0 | 1,944.667 | 1,291.333 | $616,666.667 | $616,666.667 | $319.333 | — | 65 | ||||
| Median | 1,938 | $615,000 | $615,000 | ||||||||||
Market Analysis
List vs Sale $/SqFt
Sale Price Trend
Days on Market
Sale vs List Price
This analysis was generated automatically from MLS data. For an in-depth, human-reviewed valuation, contact Joseph Sardella at josephsardella@gmail.com.