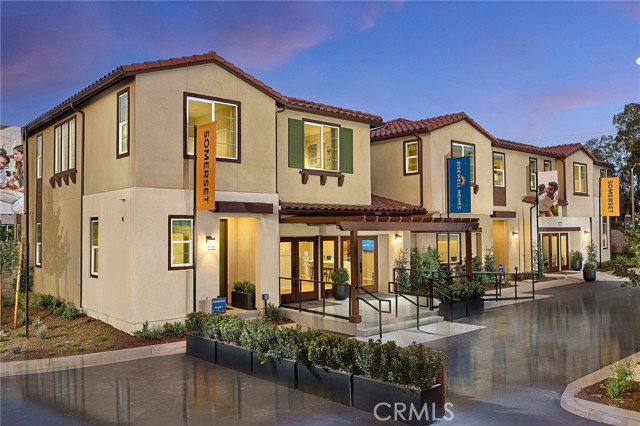
5830 Walden Court, Eastvale, CA 92880
5830 Walden Court, Eastvale, CA 92880
Property Description
Discover modern comfort and thoughtful design in this beautifully planned two-story home, featuring an open concept first floor with a spacious great room that flows seamlessly into the dining area and a stylish kitchen complete with a large island, pantry, and ample storage. A welcoming front porch, convenient powder room, and attached 2 car garage with extra storage add everyday practicality. Upstairs, a generous loft anchors the second level, leading to a serene primary suite with a walk in closet and well-appointed bath, along with two additional bedrooms—plus a full bath and a dedicated laundry room. This smart layout offers the perfect blend of functionality, comfort, and contemporary living.
Features & Amenities
Property Details
Mortgage Calculator
Current Rates
Comparative Market Analysis
Residential Tier · 5 active · 5 closed
Eastvale · Townhouse
Listed 10.6% above the median closed sale of $632,990.
Price Position
Positioned above the market — commands a premium.
Active Properties (5)
Active Comparables
| Address | City | Year | BD | BTH | SqFt | LotSz | LP/SqFt | LP | DIM | Score |
|---|---|---|---|---|---|---|---|---|---|---|
| 12668 Rosemount Road | Eastvale | 2027 | 3 | 3 | 1,751 | 0 | $391 | $684,990 | 34 | 96 |
| 5906 Belmont Court | Eastvale | 2027 | 3 | 4 | 2,164 | 0 | $311 | $673,990 | 35 | 95 |
| 5912 Belmont Court | Eastvale | 2027 | 3 | 4 | 1,860 | 0 | $347 | $645,990 | 35 | 95 |
| 5912 Rockport Rd | Eastvale | 2026 | 3 | 3 | 1,721 | 0 | $378 | $649,990 | 122 | 95 |
| 5892 Rockport Road | Eastvale | 2027 | 3 | 3 | 1,605 | 0 | $387 | $620,990 | 35 | 94 |
| Total: 5 · Average | 3.0 | 3.4 | 1,820.2 | 0 | $362.8 | $655,190 | 52.2 | |||
| Median | 1,751 | $649,990 | ||||||||
Closed Properties (5)
Closed Comparables
| Address | City | Year | Date | BD | BTH | SqFt | LotSz | LP | SP | SP/SqFt | SP/LP | DIM | Score |
|---|---|---|---|---|---|---|---|---|---|---|---|---|---|
| 5829 Walden Court | Eastvale | 2026 | 09/29/2026 | 3 | 3 | 2,020 | 0 | $780,990 | $735,990 | $364 | 0.94 | 42 | 99 |
| 12701 Sahara Street | Eastvale | 2026 | 09/11/2026 | 3 | 4 | 2,164 | 0 | $673,990 | $673,990 | $311 | 1.00 | 57 | 95 |
| 5927 Gramercy Way | Eastvale | 2026 | 08/20/2026 | 3 | 4 | 1,860 | 0 | $644,990 | $632,990 | $340 | 0.98 | 35 | 95 |
| 12784 Bolsa Drive | Eastvale | 2026 | 09/20/2026 | 3 | 3 | 1,579 | 0 | $609,990 | $599,990 | $380 | 0.98 | 51 | 94 |
| 12782 Lomond Way | Eastvale | 2025 | 04/28/2026 | 3 | 3 | 1,772 | 0 | $645,990 | $618,910 | $349 | 0.96 | 98 | 94 |
| Total: 5 · Average | 3.0 | 3.4 | 1,879 | 0 | $652,374 | $652,374 | $348.8 | — | 56.6 | ||||
| Median | 1,860 | $632,990 | $632,990 | ||||||||||
Market Analysis
List vs Sale $/SqFt
Sale Price Trend
Days on Market
Sale vs List Price
This analysis was generated automatically from MLS data. For an in-depth, human-reviewed valuation, contact Joseph Sardella at josephsardella@gmail.com.