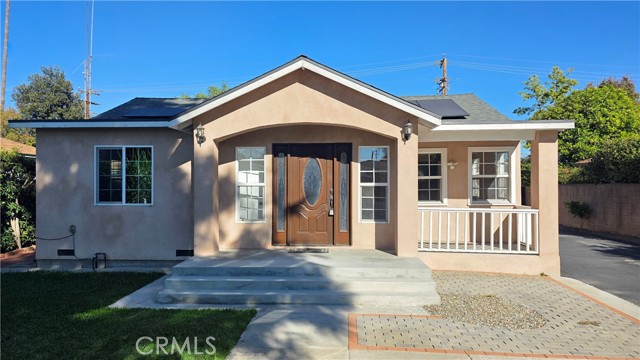
5638 Persimmon, Temple City, CA 91780
5638 Persimmon, Temple City, CA 91780
Property Description
More Pictures to come. The front house is a 3-bedroom, 2 Bathroom house @ 1,738 Square Feet. Back house is 2 Bedroom and 2 bathroom @ 879 square feet. The back house has been completed in recent years and permitted. Each unit has its own private yard.
Features & Amenities
Property Details
Mortgage Calculator
Current Rates
Comparative Market Analysis
Luxury Tier · 5 active · 5 closed
Temple City · Single Family Residence
Listed 8.0% above the median closed sale of $1,480,000. Price per sqft ($611) is a 23% discount to closed comps ($795). Closed comps sold at 103% of list — strong seller's market. Luxury tier — fewer comparable sales widen the confidence range.
Price Position
Positioned above the market — commands a premium.
Active Properties (5)
Active Comparables
| Address | City | Year | BD | BTH | SqFt | LotSz | LP/SqFt | LP | DIM | Score |
|---|---|---|---|---|---|---|---|---|---|---|
| 50 Woodruff Avenue | Arcadia | 1952 | 4 | 3 | 2,646 | 10,147 | $691 | $1.83M | 13 | 89 |
| 5224 Hallowell Avenue | Temple City | 1947 | 5 | 5 | 2,851 | 8,064 | $509 | $1.45M | 61 | 87 |
| 5629 Gracewood Avenue | Arcadia | 2002 | 4 | 3 | 2,540 | 8,868 | $705 | $1.79M | 116 | 86 |
| 2508 Woodruff Way | Arcadia | 1946 | 6 | 5 | 3,127 | 11,822 | $505 | $1.58M | 54 | 83 |
| 68 Arthur | Arcadia | 1963 | 3 | 3 | 1,938 | 7,126 | $841 | $1.63M | 13 | 76 |
| Total: 5 · Average | 4.4 | 3.8 | 2,620.4 | 9,205.4 | $650.2 | $1.66M | 51.4 | |||
| Median | 2,646 | $1.63M | ||||||||
Closed Properties (5)
Closed Comparables
| Address | City | Year | Date | BD | BTH | SqFt | LotSz | LP | SP | SP/SqFt | SP/LP | DIM | Score |
|---|---|---|---|---|---|---|---|---|---|---|---|---|---|
| 185 Longley | Arcadia | 1964 | 08/27/2026 | 3 | 3 | 2,140 | 8,773 | $1.45M | $1.48M | $692 | 1.02 | 45 | 85 |
| 75 Woodruff Avenue | Arcadia | 1946 | 08/14/2026 | 3 | 2 | 1,653 | 11,658 | $1.19M | $1.41M | $853 | 1.18 | 22 | 76 |
| 2616 Longley Way | Arcadia | 1950 | 08/03/2026 | 3 | 3 | 1,736 | 13,618 | $1.39M | $1.39M | $801 | 1.00 | 20 | 74 |
| 51 Miren Place | Arcadia | 2023 | 11/12/2025 | 4 | 3 | 2,211 | 3,210 | $1.89M | $1.82M | $825 | 0.97 | 90 | 73 |
| 249 Las Tunas | Arcadia | 1947 | 09/17/2026 | 3 | 2 | 2,113 | 16,121 | $1.70M | $1.70M | $805 | 1.00 | 70 | 71 |
| Total: 5 · Average | 3.2 | 2.6 | 1,970.6 | 10,676 | $1.56M | $1.56M | $795.2 | — | 49.4 | ||||
| Median | 2,113 | $1.48M | $1.48M | ||||||||||
Market Analysis
List vs Sale $/SqFt
Sale Price Trend
Days on Market
Sale vs List Price
This analysis was generated automatically from MLS data. For an in-depth, human-reviewed valuation, contact Joseph Sardella at josephsardella@gmail.com.