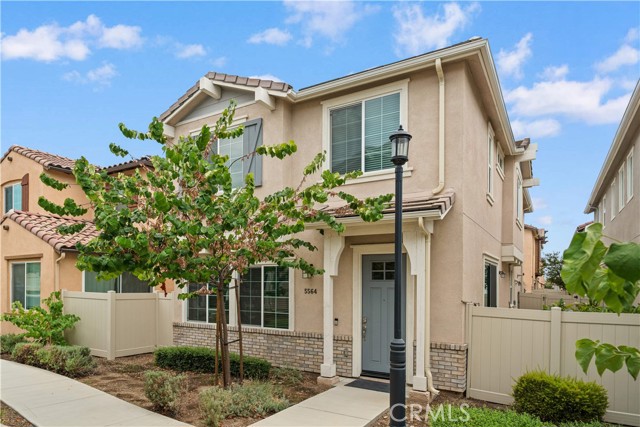
5564 Valencia, Montclair, CA 91762
5564 Valencia, Montclair, CA 91762
Property Description
Welcome to this beautifully maintained home in one of Montclair's desirable newer communities. Offering a sought-after north-south orientation, this residence combines comfort, functionality, and low-maintenance living. The thoughtfully designed floor plan features 3 bedrooms plus an enclosed bonus room, creating versatile space that can easily serve as a home office, playroom, guest room, or potential fourth bedroom. The open-concept main level seamlessly connects the living, dining, and kitchen areas, featuring abundant natural light, white cabinetry, generous counter space, and a large center island. Upstairs offers three comfortable bedrooms, the versatile bonus room, and a dedicated laundry room with built-in cabinetry. Enjoy a private side yard along with community green spaces, a playground, and outdoor gathering areas. Low HOA dues and NO MELLO-ROOS make this home even more attractive. Conveniently located near shopping, dining, schools, parks, and major commuter routes. Move-in ready and an exceptional value!
Features & Amenities
Property Details
Mortgage Calculator
Current Rates
Comparative Market Analysis
Residential Tier · 5 active · 5 closed
Montclair · Single Family Residence
Listed 5.9% below the median closed sale of $690,000. Price per sqft ($332) is a 25% discount to closed comps ($444).
Price Position
Priced below the market — value advantage over the field.
Active Properties (5)
Active Comparables
| Address | City | Year | BD | BTH | SqFt | LotSz | LP/SqFt | LP | DIM | Score |
|---|---|---|---|---|---|---|---|---|---|---|
| 4986 Aldina | Montclair | 2018 | 3 | 3 | 1,955 | 1,000 | $357 | $697,000 | 23 | 87 |
| 11569 Miramar Lane | Chino | 2019 | 3 | 3 | 1,860 | 2,204 | $376 | $699,000 | 19 | 76 |
| 4985 Manzanita Street | Montclair | 1986 | 2 | 3 | 1,398 | 3,713 | $450 | $629,000 | 2 | 64 |
| 858 Benson | Ontario | 1956 | 3 | 2 | 1,632 | 7,272 | $416 | $679,000 | 42 | 63 |
| 1239 Vine Avenue | Ontario | 1960 | 3 | 2 | 2,025 | 13,000 | $346 | $700,000 | 31 | 63 |
| Total: 5 · Average | 2.8 | 2.6 | 1,774 | 5,437.8 | $389 | $680,800 | 23.4 | |||
| Median | 1,860 | $697,000 | ||||||||
Closed Properties (5)
Closed Comparables
| Address | City | Year | Date | BD | BTH | SqFt | LotSz | LP | SP | SP/SqFt | SP/LP | DIM | Score |
|---|---|---|---|---|---|---|---|---|---|---|---|---|---|
| 5314 Malibu | Chino | 2020 | 06/16/2026 | 3 | 3 | 1,860 | 2,594 | $698,000 | $715,000 | $384 | 1.02 | 48 | 75 |
| 11533 Cambria Court | Chino | 2017 | 04/24/2026 | 4 | 3 | 2,034 | 2,093 | $735,000 | $700,000 | $344 | 0.95 | 92 | 71 |
| 1217 Vesta | Ontario | 1956 | 08/17/2026 | 4 | 2 | 1,356 | 7,210 | $684,000 | $690,000 | $509 | 1.01 | 31 | 61 |
| 1540 D | Ontario | 1954 | 05/05/2026 | 3 | 2 | 1,204 | 6,426 | $599,900 | $560,000 | $465 | 0.93 | 46 | 61 |
| 1310 Hollowell | Ontario | 1974 | 05/07/2026 | 3 | 2 | 1,240 | 7,810 | $624,900 | $640,000 | $516 | 1.02 | 30 | 61 |
| Total: 5 · Average | 3.4 | 2.4 | 1,538.8 | 5,226.6 | $661,000 | $661,000 | $443.6 | — | 49.4 | ||||
| Median | 1,356 | $690,000 | $690,000 | ||||||||||
Market Analysis
List vs Sale $/SqFt
Sale Price Trend
Days on Market
Sale vs List Price
This analysis was generated automatically from MLS data. For an in-depth, human-reviewed valuation, contact Joseph Sardella at josephsardella@gmail.com.