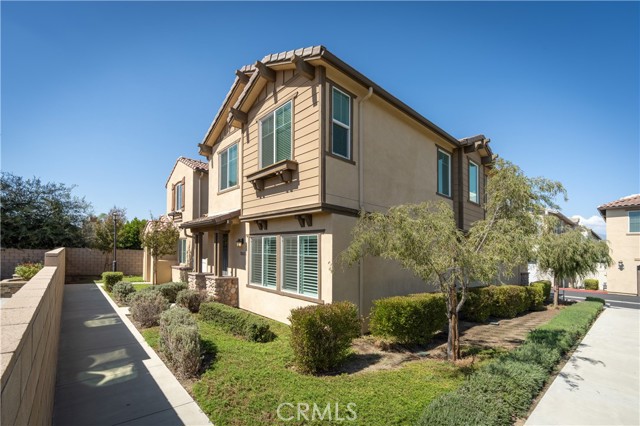
5563 Soria Drive, Montclair, CA 91762
5563 Soria Drive, Montclair, CA 91762
Property Description
Built in 2020. Cared for like it was finished yesterday. This four bedroom, two and a half bath end unit sits in a gated Montclair community with no shared walls. Single-family privacy. Condo convenience. Upgraded finishes run throughout. Every bedroom offers generous closet space, and two pantry areas keep the kitchen clutter-free. The finished garage features epoxy floors and EV charger ready outlets. A tankless water heater and solar keep energy costs low. The community includes a playground and fitness area, with shopping, dining, entertainment, and freeway access just minutes away. Gated. No shared walls. Smart upgrades. Come see it before someone else does.
Features & Amenities
Property Details
Mortgage Calculator
Current Rates
Comparative Market Analysis
Residential Tier · 1 active · 2 closed
Montclair · Condominium
Listed 13.1% above the median closed sale of $618,000. Price per sqft ($358) is a 22% discount to closed comps ($460). Closed comps sold at 102% of list — strong seller's market.
Price Position
Positioned above the market — commands a premium.
Active Properties (1)
Active Comparables
| Address | City | Year | BD | BTH | SqFt | LotSz | LP/SqFt | LP | DIM | Score |
|---|---|---|---|---|---|---|---|---|---|---|
| 573 Wayland Court | Claremont | 1981 | 2 | 3 | 1,499 | 1,736 | $400 | $599,000 | 32 | 52 |
| Total: 1 · Average | 2.0 | 3.0 | 1,499 | 1,736 | $400 | $599,000 | 32 | |||
| Median | 1,499 | $599,000 | ||||||||
Closed Properties (2)
Closed Comparables
| Address | City | Year | Date | BD | BTH | SqFt | LotSz | LP | SP | SP/SqFt | SP/LP | DIM | Score |
|---|---|---|---|---|---|---|---|---|---|---|---|---|---|
| 643 College Avenue | Claremont | 1981 | 12/15/2025 | 4 | 3 | 1,343 | 206,518 | $615,000 | $638,000 | $475 | 1.04 | 31 | 48 |
| 675 College Avenue | Claremont | 1981 | 09/10/2025 | 4 | 3 | 1,343 | 206,518 | $600,000 | $598,000 | $445 | 1.00 | 61 | 48 |
| Total: 2 · Average | 4.0 | 3.0 | 1,343 | 206,518 | $618,000 | $618,000 | $460 | — | 46 | ||||
| Median | 1,343 | $638,000 | $638,000 | ||||||||||
Market Analysis
List vs Sale $/SqFt
Sale Price Trend
Days on Market
Sale vs List Price
This analysis was generated automatically from MLS data. For an in-depth, human-reviewed valuation, contact Joseph Sardella at josephsardella@gmail.com.