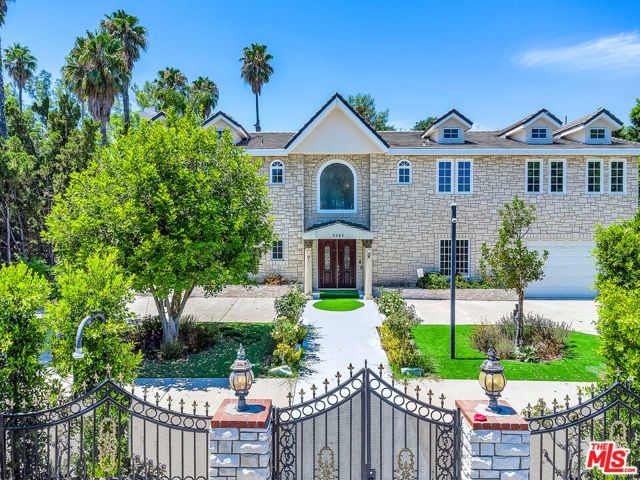
5545 Aura Avenue, Tarzana, CA 91356
5545 Aura Avenue, Tarzana, CA 91356
Property Description
The spacious two-story, with elevator 5-bedroom, 4.5-bathroom home is nestled just south of Ventura Blvd in Tarzana. This exquisite property boasts an 18,000 sqft lot with unparalleled luxury. The home features Italian marble flooring throughout the first floor and hardwood flooring on the second. The gourmet kitchen is equipped with high-end Thermador appliances. Entertain in style with an extraordinary outdoor kitchen and bar, perfect for hosting unforgettable gatherings, and enjoy the stunning pool. Conveniently equipped with smart home features like DoorBird, this home combines classic elegance with contemporary convenience. With Tarzana property prices on the rise, this gem offers a rare opportunity to own a piece of the area's finest real estate
Features & Amenities
Property Details
Mortgage Calculator
Current Rates
Comparative Market Analysis
Luxury Tier · 5 active · 5 closed
Tarzana · Single Family Residence
Listed 3.6% above the median closed sale of $2,650,000. Price per sqft ($501) is a 25% discount to closed comps ($664). Expect a longer timeline — comps averaged 153 days on market. Luxury tier — fewer comparable sales widen the confidence range.
Price Position
Aligned with the market — fair pricing for the comps.
Active Properties (5)
Active Comparables
| Address | City | Year | BD | BTH | SqFt | LotSz | LP/SqFt | LP | DIM | Score |
|---|---|---|---|---|---|---|---|---|---|---|
| 19436 Hatteras Street | Tarzana | 1964 | 7 | 6 | 4,705 | 16,699 | $627 | $2.95M | 76 | 77 |
| 5431 Lubao Avenue | Woodland Hills | 1961 | 5 | 5 | 3,298 | 17,160 | $876 | $2.89M | 13 | 72 |
| 5923 Corbin Avenue | Tarzana | 1949 | 5 | 5 | 2,753 | 18,018 | $970 | $2.67M | 60 | 72 |
| 5020 Bilmoor Avenue | Los Angeles | 1960 | 4 | 3 | 3,438 | 20,977 | $797 | $2.74M | 47 | 66 |
| 4965 Calvin Avenue | Tarzana | 1960 | 4 | 3 | 0 | 15,596 | $0 | $2.85M | 641 | 59 |
| Total: 5 · Average | 5.0 | 4.4 | 3,548.5 | 17,690 | $817.5 | $2.82M | 167.4 | |||
| Median | 3,438 | $2.85M | ||||||||
Closed Properties (5)
Closed Comparables
| Address | City | Year | Date | BD | BTH | SqFt | LotSz | LP | SP | SP/SqFt | SP/LP | DIM | Score |
|---|---|---|---|---|---|---|---|---|---|---|---|---|---|
| 5313 Crebs Avenue | Tarzana | 1962 | 10/15/2026 | 5 | 6 | 3,786 | 17,348 | $3.10M | $3.10M | $817 | 1.00 | 98 | 73 |
| 5110 Allentown Place | Woodland Hills | 1993 | 10/01/2026 | 5 | 6 | 4,955 | 16,086 | $2.90M | $2.65M | $535 | 0.91 | 77 | 73 |
| 20226 Lorenzana Drive | Woodland Hills | 1963 | 06/04/2026 | 5 | 4 | 4,361 | 17,936 | $3.00M | $2.82M | $647 | 0.94 | 352 | 70 |
| 5649 Rawlings Avenue | Woodland Hills | 2022 | 06/17/2026 | 4 | 5 | 4,239 | 16,416 | $2.50M | $2.51M | $592 | 1.01 | 70 | 69 |
| 5329 Mecca Avenue | Tarzana | 1936 | 07/24/2026 | 5 | 4 | 3,500 | 17,755 | $2.75M | $2.55M | $729 | 0.93 | 169 | 68 |
| Total: 5 · Average | 4.8 | 5.0 | 4,168.2 | 17,108.2 | $2.73M | $2.73M | $664 | — | 153.2 | ||||
| Median | 4,239 | $2.65M | $2.65M | ||||||||||
Market Analysis
List vs Sale $/SqFt
Sale Price Trend
Days on Market
Sale vs List Price
This analysis was generated automatically from MLS data. For an in-depth, human-reviewed valuation, contact Joseph Sardella at josephsardella@gmail.com.