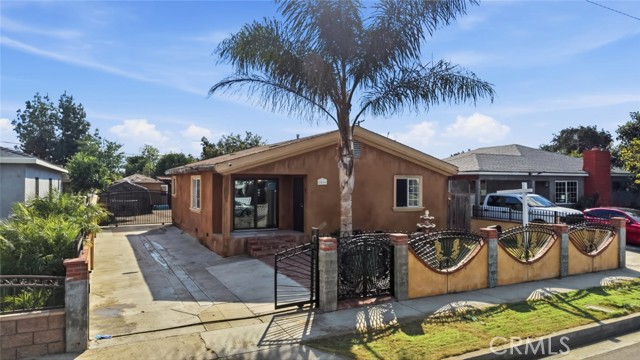
5516 Rayborn Street, Lynwood, CA 90262
5516 Rayborn Street, Lynwood, CA 90262
Property Description
Big possibilities await at 5516 Rayborn St. This 3-bedroom, 2-bathroom home offers 1,278 square feet of living space and sits on a generous 6,739 sqft lot with room to explore ADU potential, subject to buyer verification and city requirements. Enjoy convenient access to the 710, 105, and 91 freeways, plus nearby restaurants and shopping. Whether you’re looking for a place to make your own or a property with room to envision more, this Lynwood home is full of opportunity.
Features & Amenities
Property Details
Mortgage Calculator
Current Rates
Comparative Market Analysis
Affordable Tier · 5 active · 5 closed
Lynwood · Single Family Residence
Listed in line with the median closed sale of $720,000. Price per sqft ($547) is a 23% discount to closed comps ($707). Closed comps sold at 102% of list — strong seller's market.
Price Position
Aligned with the market — fair pricing for the comps.
Active Properties (5)
Active Comparables
| Address | City | Year | BD | BTH | SqFt | LotSz | LP/SqFt | LP | DIM | Score |
|---|---|---|---|---|---|---|---|---|---|---|
| 5426 Rayborn | Lynwood | 1940 | 3 | 2 | 1,076 | 6,682 | $697 | $750,000 | 25 | 95 |
| 4256 Brewster Avenue | Lynwood | 1937 | 3 | 2 | 1,133 | 5,013 | $618 | $699,999 | 5 | 88 |
| 14708 Lime Avenue | Compton | 1948 | 3 | 1 | 1,320 | 4,874 | $568 | $750,000 | 59 | 84 |
| 4170 Lavinia | Lynwood | 1953 | 3 | 2 | 1,791 | 5,577 | $441 | $789,999 | 46 | 78 |
| 14517 White | Compton | 1940 | 2 | 1 | 731 | 6,662 | $847 | $619,000 | 4 | 77 |
| Total: 5 · Average | 2.8 | 1.6 | 1,210.2 | 5,761.6 | $634.2 | $721,799.6 | 27.8 | |||
| Median | 1,133 | $750,000 | ||||||||
Closed Properties (5)
Closed Comparables
| Address | City | Year | Date | BD | BTH | SqFt | LotSz | LP | SP | SP/SqFt | SP/LP | DIM | Score |
|---|---|---|---|---|---|---|---|---|---|---|---|---|---|
| 5501 Rayborn | Lynwood | 1940 | 05/15/2026 | 3 | 1 | 816 | 6,675 | $709,900 | $700,000 | $858 | 0.99 | 46 | 85 |
| 6610 San Carlos Street | Paramount | 1953 | 06/30/2026 | 3 | 2 | 1,052 | 6,406 | $788,888 | $799,000 | $760 | 1.01 | 51 | 85 |
| 5230 Lavinia Ave | Lynwood | 1941 | 05/15/2026 | 3 | 1 | 1,056 | 5,011 | $695,000 | $720,000 | $682 | 1.04 | 36 | 84 |
| 6552 San Juan Street | Paramount | 1937 | 06/01/2026 | 2 | 1 | 1,136 | 6,099 | $705,000 | $740,000 | $651 | 1.05 | 39 | 84 |
| 12318 Halo | Lynwood | 1954 | 01/15/2026 | 3 | 2 | 1,154 | 5,320 | $675,000 | $675,000 | $585 | 1.00 | 66 | 83 |
| Total: 5 · Average | 2.8 | 1.4 | 1,042.8 | 5,902.2 | $726,800 | $726,800 | $707.2 | — | 47.6 | ||||
| Median | 1,056 | $720,000 | $720,000 | ||||||||||
Market Analysis
List vs Sale $/SqFt
Sale Price Trend
Days on Market
Sale vs List Price
This analysis was generated automatically from MLS data. For an in-depth, human-reviewed valuation, contact Joseph Sardella at josephsardella@gmail.com.