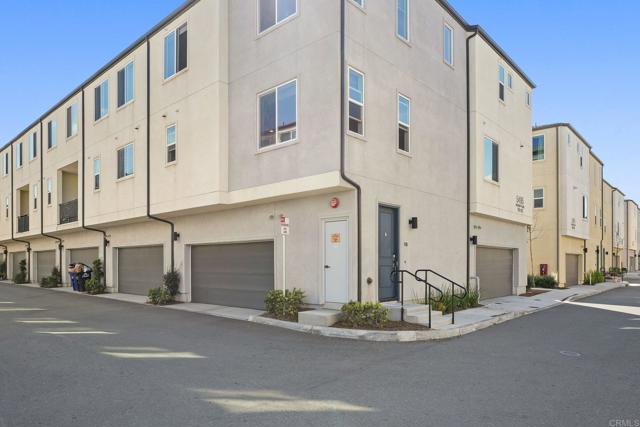
5495 Seacliff Place, 116, San Diego, CA 92154
5495 Seacliff Place, 116, San Diego, CA 92154
Property Description
Price reduction!! VA APPROVED! ALL MILITARY WELCOME! Appraised at $577,500 Room for closing costs credit. This CORNER-UNIT HOME with OWNED SOLAR in desirable La Brisa Community. LOWEST PRICED UNIT IN COMPLEX. NEWER 2022 BUILD! Move in ready, upgraded 2 Bedroom, 2.5 Bathroom. Tri-level home with open concept bright and spacious living area, modern finishes, STAINLESS STEEL appliances, Laminate wood flooring as on the second and third floor. New carpet on all stairs. Plenty of STORAGE CLOSETS and direct access to attached 2-CAR GARAGE with Level 2 EV charging station . The main living level offers a comfortable spacious open layout, with a 1/2 BATH ON THE 2ND FLOOR, perfect for convenience and guests! UPSTAIRS LAUNDRY, Both bedrooms include their own EN-SUITE BATHROOMS, giving the home a practical and private layout. Close to freeways, shopping, dining, parks, hospital and schools. OWNED SOLAR, ENERGY EFFICIENT - - LOW HOA - 2-CAR GARAGE - STORAGE CLOSETS - UPSTAIRS LAUNDRY - MOVE-IN READY. Enjoy the tranquility of this neighborhood. Easily accessible to the freeway, seamless connectivity to San Diego's major attractions, restaurants, beaches
Features & Amenities
Property Details
Mortgage Calculator
Current Rates
Comparative Market Analysis
Affordable Tier · 5 active · 5 closed
San Diego · Townhouse
Listed 12.1% below the median closed sale of $630,000.
Price Position
Priced below the market — value advantage over the field.
Active Properties (5)
Active Comparables
| Address | City | Year | BD | BTH | SqFt | LotSz | LP/SqFt | LP | DIM | Score |
|---|---|---|---|---|---|---|---|---|---|---|
| 5494 Seacliff Place | San Diego | 2022 | 2 | 3 | 1,309 | 0 | $451 | $590,000 | 70 | 96 |
| 5252 Beachfront | San Diego | 2021 | 2 | 3 | 1,310 | 0 | $457 | $599,000 | 25 | 93 |
| 5230 Calle Rockfish | San Diego | 2018 | 3 | 3 | 1,452 | 0 | $430 | $625,000 | 4 | 86 |
| 5280 Beachfront Cove | San Diego | 2021 | 4 | 3 | 1,696 | 0 | $353 | $599,000 | 31 | 80 |
| 5470 Shorefront Drive | San Diego | 2022 | 4 | 4 | 1,785 | 0 | $353 | $629,900 | 13 | 80 |
| Total: 5 · Average | 3.0 | 3.2 | 1,510.4 | 0 | $408.8 | $608,580 | 28.6 | |||
| Median | 1,452 | $599,000 | ||||||||
Closed Properties (5)
Closed Comparables
| Address | City | Year | Date | BD | BTH | SqFt | LotSz | LP | SP | SP/SqFt | SP/LP | DIM | Score |
|---|---|---|---|---|---|---|---|---|---|---|---|---|---|
| 5490 Shorefront Drive | San Diego | 2022 | 06/29/2026 | 2 | 3 | 1,309 | 0 | $585,000 | $590,000 | $451 | 1.01 | 52 | 98 |
| 5501 San Rafael | San Diego | 2021 | 07/28/2026 | 3 | 3 | 1,600 | 0 | $650,000 | $630,000 | $394 | 0.97 | 129 | 86 |
| 2072 Vela Lane | San Diego | 2023 | 07/13/2026 | 3 | 3 | 1,385 | 0 | $625,000 | $630,000 | $455 | 1.01 | 61 | 80 |
| 5200 Beachside Lane | San Diego | 2018 | 08/07/2026 | 3 | 3 | 1,740 | 0 | $640,000 | $630,000 | $362 | 0.98 | 42 | 79 |
| 1320 Calle sandcliff | San Diego | 2018 | 09/18/2026 | 4 | 4 | 1,831 | 0 | $650,000 | $635,000 | $347 | 0.98 | 36 | 71 |
| Total: 5 · Average | 3.0 | 3.2 | 1,573 | 0 | $623,000 | $623,000 | $401.8 | — | 64 | ||||
| Median | 1,600 | $630,000 | $630,000 | ||||||||||
Market Analysis
List vs Sale $/SqFt
Sale Price Trend
Days on Market
Sale vs List Price
This analysis was generated automatically from MLS data. For an in-depth, human-reviewed valuation, contact Joseph Sardella at josephsardella@gmail.com.