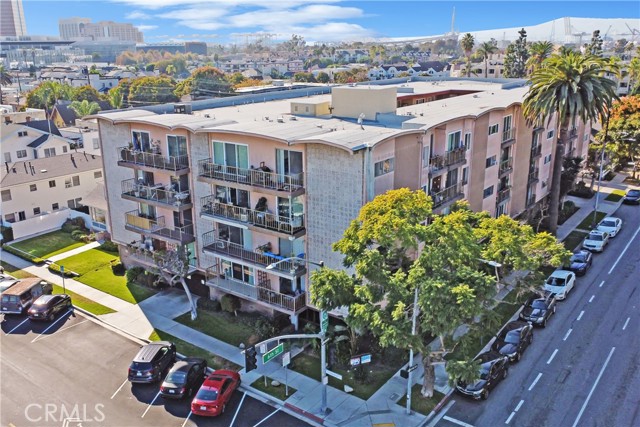
545 Chestnut Avenue, 406, Long Beach, CA 90802
545 Chestnut Avenue, 406, Long Beach, CA 90802
Property Description
TIRED OF RENTING? Unlock the door to homeownership with this charming one-bedroom, one-bathroom condominium in the Willmore City Historic District of Long Beach. This top floor unit offers a nice view of the downtown Long Beach skyline right from your bedroom. This community’s prime location offers something for everyone, with proximity to local schools, Shoreline Village’s waterfront shopping and dining, the Long Beach Convention Center, the Aquarium of the Pacific and more! Easy access to the 710 freeway, major bus lines and the Metro light-rail station in Downtown Long Beach. Act fast—this top-floor condo won’t last long.
Features & Amenities
Property Details
Mortgage Calculator
Current Rates
Comparative Market Analysis
Affordable Tier · 5 active · 5 closed
Long Beach · Condominium
Listed 6.5% below the median closed sale of $294,500.
Price Position
Priced below the market — value advantage over the field.
Active Properties (5)
Active Comparables
| Address | City | Year | BD | BTH | SqFt | LotSz | LP/SqFt | LP | DIM | Score |
|---|---|---|---|---|---|---|---|---|---|---|
| 460 Golden Avenue | Long Beach | 1983 | 1 | 1 | 495 | 15,988 | $606 | $299,900 | 32 | 84 |
| 815 Pacific Avenue | Long Beach | 1955 | 1 | 1 | 542 | 7,505 | $553 | $299,900 | 92 | 83 |
| 800 Pacific Avenue | Long Beach | 1921 | 1 | 1 | 694 | 13,238 | $454 | $315,000 | 75 | 82 |
| 315 3rd | Long Beach | 1925 | 0 | 1 | 456 | 22,493 | $548 | $250,000 | 54 | 79 |
| 315 3rd Street | Long Beach | 1925 | 1 | 1 | 457 | 22,493 | $602 | $275,000 | 228 | 79 |
| Total: 5 · Average | 0.8 | 1.0 | 528.8 | 16,343.4 | $552.6 | $287,960 | 96.2 | |||
| Median | 495 | $299,900 | ||||||||
Closed Properties (5)
Closed Comparables
| Address | City | Year | Date | BD | BTH | SqFt | LotSz | LP | SP | SP/SqFt | SP/LP | DIM | Score |
|---|---|---|---|---|---|---|---|---|---|---|---|---|---|
| 640 4th | Long Beach | 1990 | 06/17/2026 | 1 | 1 | 644 | 29,280 | $310,000 | $300,000 | $466 | 0.97 | 145 | 87 |
| 800 Pacific Avenue | Long Beach | 1921 | 08/25/2026 | 1 | 1 | 651 | 13,238 | $280,000 | $280,000 | $430 | 1.00 | 40 | 85 |
| 528 Cedar Boulevard | Long Beach | 1960 | 06/05/2026 | 1 | 1 | 812 | 17,363 | $329,000 | $315,000 | $388 | 0.96 | 60 | 84 |
| 728 Cedar | Long Beach | 1956 | 12/02/2025 | 1 | 1 | 599 | 0 | $279,900 | $282,400 | $471 | 1.01 | 47 | 84 |
| 800 Pacific Avenue | Long Beach | 1921 | 01/23/2026 | 1 | 1 | 688 | 13,238 | $299,500 | $294,500 | $428 | 0.98 | 72 | 82 |
| Total: 5 · Average | 1.0 | 1.0 | 678.8 | 18,279.75 | $294,380 | $294,380 | $436.6 | — | 72.8 | ||||
| Median | 651 | $294,500 | $294,500 | ||||||||||
Market Analysis
List vs Sale $/SqFt
Sale Price Trend
Days on Market
Sale vs List Price
This analysis was generated automatically from MLS data. For an in-depth, human-reviewed valuation, contact Joseph Sardella at josephsardella@gmail.com.