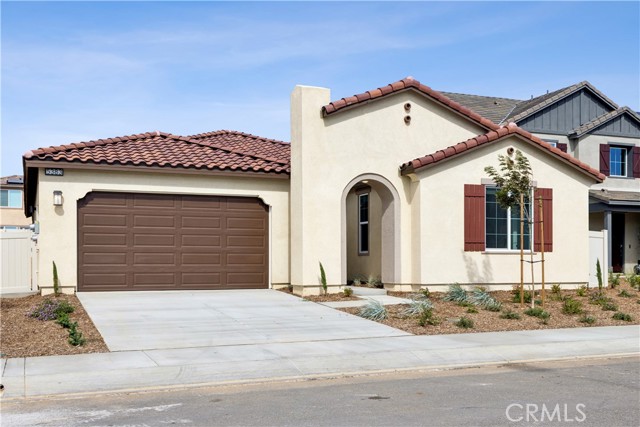
1 / 20
5383 Hoffer Street, Banning, CA 92220
$559K3bd · 2ba · 2,135 sqft
Lot 6,379 sqft•HOA $195/mo•Single Family Residence•Active•24d on market•MLS# IV-26215352
5383 Hoffer Street, Banning, CA 92220
MLS# IV-26215352•Residential•Single Family Residence
Active24 days on market
$559,000
3
Beds
2
Baths
2,135
Sq Ft
6,379
Lot Sq Ft
$195
HOA/mo
2026
Year Built
None
View
Property Description
Move in Ready! Welcome to this beautifully designed single-story Landmark floor plan, where the open-concept kitchen takes center stage, seamlessly connecting to the great room and dining area—perfect for entertaining. The home features 3 spacious bedrooms and a versatile den.
Features & Amenities
FeeBuilt 2026
Property Details
Land Type
Fee
Year Built
2026
Property Type
Residential
Property Subtype
Single Family Residence
Parking Spaces
2
Garage Spaces
2
Cooling
Central Air
View
None
City
Banning
Zip Code
92220
County
Riverside
Mortgage Calculator
Current Rates
$
$
%
Monthly Payment
$2,826.61
Principal & Interest
Loan Amount
$447,200
Total Interest
$570,379
Total Payment Over 30 Years
$1,017,579
This calculator provides estimates only. Actual mortgage payments may include taxes, insurance, HOA fees, and PMI. Contact a lender for accurate quotes.
Comparative Market Analysis
Residential Tier · 5 active · 5 closed
5383 Hoffer Street, Banning, CA 92220
Banning · Single Family Residence
$559K
Residential TierBeds
3
Baths
2
Sqft
2,135
Lot
6,379 sqft
Year
2026
$/Sqft
$262
Pool: No✓
Spa: No✓
View: None✓
Garage: 2-car✓
Listed in line with the median closed sale of $564,000. Closed comps sold at 104% of list — strong seller's market. Expect a longer timeline — comps averaged 203 days on market.
Price Position
Aligned with the market — fair pricing for the comps.
At market
Subject listed at $559K· $262/sqft
Total list price
Closed comps
vs closed median $564K
−$5K (−0.9%)
Active comps
vs active median $506K
+$53K (+10.5%)
Price per sqft
Closed compsinsufficient comp data
Active comps
vs active avg $/sqft $242
+$20 (+8.1%)
Active Properties (5)
Active Comparables
| Address | City | Year | BD | BTH | SqFt | LotSz | LP/SqFt | LP | DIM | Score |
|---|---|---|---|---|---|---|---|---|---|---|
| 1467 Broadstream Way | Banning | 2026 | 3 | 2 | 1,958 | 6,026 | $272 | $533,056 | 23 | 95 |
| 5518 Kiwi Court | Banning | 2027 | 3 | 3 | 1,957 | 6,274 | $252 | $493,000 | 22 | 92 |
| 1083 Plumwood Lane | Banning | 2026 | 4 | 3 | 2,286 | 5,973 | $238 | $544,000 | 118 | 91 |
| 5538 Kiwi Court | Banning | 2027 | 4 | 3 | 2,195 | 5,496 | $231 | $506,000 | 15 | 90 |
| 1131 Rockcress | Banning | 2023 | 4 | 3 | 2,282 | 5,227 | $219 | $499,000 | 47 | 89 |
| Total: 5 · Average | 3.6 | 2.8 | 2,135.6 | 5,799.2 | $242.4 | $515,011.2 | 45 | |||
| Median | 2,195 | $506,000 | ||||||||
Closed Properties (5)
Closed Comparables
| Address | City | Year | Date | BD | BTH | SqFt | LotSz | LP | SP | SP/SqFt | SP/LP | DIM | Score |
|---|---|---|---|---|---|---|---|---|---|---|---|---|---|
| 5405 Pinedrop Circle | Banning | 2026 | 09/10/2026 | 3 | 2 | 2,135 | 6,378 | $525,000 | $561,123 | $263 | 1.07 | 157 | 99 |
| 5351 Hoffer Street | Banning | 2026 | 08/14/2026 | 3 | 2 | 2,135 | 6,512 | $549,000 | $564,000 | $264 | 1.03 | 106 | 98 |
| 5422 Echo Drive | Banning | 2026 | 06/23/2026 | 3 | 2 | 2,135 | 6,862 | $529,000 | $530,237 | $248 | 1.00 | 227 | 97 |
| 5370 Echo Drive | Banning | 2025 | 05/11/2026 | 3 | 2 | 2,135 | 5,697 | $567,500 | $600,742 | $281 | 1.06 | 347 | 96 |
| 1190 Mahogany Street | Banning | 2026 | 08/31/2026 | 3 | 2 | 2,252 | 7,905 | $550,112 | $566,765 | $252 | 1.03 | 178 | 95 |
| Total: 5 · Average | 3.0 | 2.0 | 2,158.4 | 6,670.8 | $564,573.4 | $564,573.4 | $261.6 | — | 203 | ||||
| Median | 2,135 | $564,000 | $564,000 | ||||||||||
Market Analysis
List vs Sale $/SqFt
Sale Price Trend
Days on Market
Sale vs List Price
AI-generated CMA
This analysis was generated automatically from MLS data. For an in-depth, human-reviewed valuation, contact Joseph Sardella at josephsardella@gmail.com.