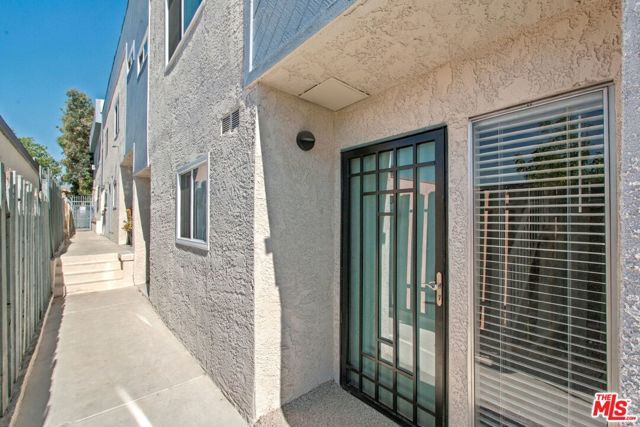
534 East Hazel Street, 6, Inglewood, CA 90302
534 East Hazel Street, 6, Inglewood, CA 90302
Property Description
Space, comfort, and a little Inglewood excitement! This spacious 2-bedroom, 2.5-bath townhouse-style condo offers a layout you'll appreciate every day. Gather in the living room around the fireplace, enjoy a coffee break on the balcony, and keep your private space upstairs, where both generously sized bedrooms feature walk-in closets. The primary bedroom has its own en-suite bathroom, with a second full bathroom upstairs and a convenient powder room downstairs for guests.Your own dedicated laundry area with a side-by-side washer and dryer makes laundry day easier, while TWO side-by-side parking spaces mean no moving one car to get the other out!With Edward Vincent Jr. Park nearby and convenient access to SoFi Stadium, Intuit Dome, Kia Forum, shopping, dining, and LAX, there's plenty to enjoy beyond your front door. Come take a look, this could be your next move!
Features & Amenities
Property Details
Mortgage Calculator
Current Rates
Comparative Market Analysis
Affordable Tier · 5 active · 5 closed
Inglewood · Townhouse
Listed in line with the median closed sale of $565,000. Closed comps sold at 101% of list — strong seller's market. Expect a longer timeline — comps averaged 157 days on market.
Price Position
Aligned with the market — fair pricing for the comps.
Active Properties (5)
Active Comparables
| Address | City | Year | BD | BTH | SqFt | LotSz | LP/SqFt | LP | DIM | Score |
|---|---|---|---|---|---|---|---|---|---|---|
| 312 Plymouth Street | Inglewood | 1988 | 2 | 3 | 1,017 | 8,276 | $481 | $489,000 | 24 | 84 |
| 515 Hazel | Inglewood | 1988 | 3 | 2 | 1,288 | 20,006 | $446 | $575,000 | 22 | 81 |
| 620 Hyde Park | Inglewood | 1983 | 2 | 2 | 1,149 | 65,895 | $474 | $545,000 | 98 | 78 |
| 532 Venice Way | Inglewood | 1989 | 2 | 2 | 1,320 | 24,065 | $416 | $549,000 | 34 | 75 |
| 882 Victor Avenue | Inglewood | 1973 | 2 | 2 | 992 | 37,487 | $489 | $485,000 | 3 | 73 |
| Total: 5 · Average | 2.2 | 2.2 | 1,153.2 | 31,145.8 | $461.2 | $528,600 | 36.2 | |||
| Median | 1,149 | $545,000 | ||||||||
Closed Properties (5)
Closed Comparables
| Address | City | Year | Date | BD | BTH | SqFt | LotSz | LP | SP | SP/SqFt | SP/LP | DIM | Score |
|---|---|---|---|---|---|---|---|---|---|---|---|---|---|
| 547 Hazel Street | Inglewood | 1987 | 07/29/2026 | 2 | 2 | 882 | 20,017 | $490,000 | $490,000 | $556 | 1.00 | 63 | 79 |
| 323 Plymouth Street | Inglewood | 1980 | 01/22/2026 | 2 | 2 | 1,268 | 11,575 | $549,000 | $565,000 | $446 | 1.03 | 224 | 79 |
| 916 65th Street | Inglewood | 1988 | 12/18/2025 | 3 | 3 | 1,380 | 22,652 | $609,900 | $630,000 | $457 | 1.03 | 208 | 71 |
| 532 Venice Way | Inglewood | 1989 | 11/18/2025 | 2 | 2 | 1,320 | 24,065 | $559,000 | $550,000 | $417 | 0.98 | 170 | 69 |
| 620 Hyde Park Boulevard | Inglewood | 1983 | 12/11/2025 | 3 | 2 | 1,415 | 65,877 | $575,000 | $575,000 | $406 | 1.00 | 119 | 64 |
| Total: 5 · Average | 2.4 | 2.2 | 1,253 | 28,837.2 | $562,000 | $562,000 | $456.4 | — | 156.8 | ||||
| Median | 1,320 | $565,000 | $565,000 | ||||||||||
Market Analysis
List vs Sale $/SqFt
Sale Price Trend
Days on Market
Sale vs List Price
This analysis was generated automatically from MLS data. For an in-depth, human-reviewed valuation, contact Joseph Sardella at josephsardella@gmail.com.