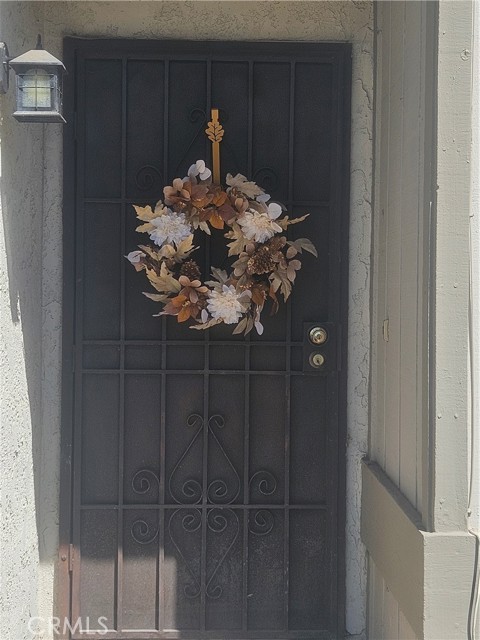
5187 Aspen Drive, Montclair, CA 91763
5187 Aspen Drive, Montclair, CA 91763
Property Description
Welcome to this charming 3-bedroom, 2.5 bath home offering 1,426 square feet of comfortable living space in a desirable community. There is a 2-car garage with direct access to the property. One of the home's standout features is the covered patio between the house and the two-car garage. This area is the perfect space for outdoor dining, entertaining, or enjoying a quiet afternoon. The community offers an array of amenities including a sparkling swimming pool, relaxing jacuzzi, and children's play area. The property is conveniently located near a hospital, post office, City Hall, and shopping mall making everyday errands and activities easily accessible. This Montclair home offers an excellent combination of convenience, comfort, and community living. This property is also close to the 10 freeway and near the Metrolink station. Come see all this home has to offer! This is a Probate Sale. Court Confirmation is not required.
Features & Amenities
Property Details
Mortgage Calculator
Current Rates
Comparative Market Analysis
Affordable Tier · 2 active · 5 closed
Montclair · Single Family Residence
Listed in line with the median closed sale of $460,000. Price per sqft ($319) is a 30% discount to closed comps ($453).
Price Position
Aligned with the market — fair pricing for the comps.
Active Properties (2)
Active Comparables
| Address | City | Year | BD | BTH | SqFt | LotSz | LP/SqFt | LP | DIM | Score |
|---|---|---|---|---|---|---|---|---|---|---|
| 1398 Sheridan | Pomona | 1915 | 4 | 3 | 1,747 | 12,078 | $283 | $495,000 | 2 | 59 |
| 412 Fern Avenue | Ontario | 1930 | 2 | 1 | 931 | 2,465 | $510 | $475,000 | 66 | 49 |
| Total: 2 · Average | 3.0 | 2.0 | 1,339 | 7,271.5 | $396.5 | $485,000 | 34 | |||
| Median | 1,747 | $495,000 | ||||||||
Closed Properties (5)
Closed Comparables
| Address | City | Year | Date | BD | BTH | SqFt | LotSz | LP | SP | SP/SqFt | SP/LP | DIM | Score |
|---|---|---|---|---|---|---|---|---|---|---|---|---|---|
| 4622 San Jose | Montclair | 1978 | 07/24/2026 | 2 | 2 | 1,254 | 3,096 | $500,000 | $510,000 | $407 | 1.02 | 74 | 75 |
| 663 Indian Hill Boulevard | Claremont | 1963 | 09/15/2026 | 2 | 2 | 1,088 | 2,300 | $450,000 | $460,000 | $423 | 1.02 | 27 | 61 |
| 10033 Del Mar Avenue | Montclair | 1952 | 06/29/2026 | 2 | 1 | 876 | 8,246 | $480,000 | $450,000 | $514 | 0.94 | 48 | 60 |
| 633 Indian Hill | Claremont | 1963 | 01/06/2026 | 2 | 2 | 1,088 | 2,274 | $456,800 | $456,800 | $420 | 1.00 | 53 | 59 |
| 5612 Bandera | Montclair | 1949 | 12/04/2025 | 2 | 1 | 959 | 9,120 | $568,000 | $480,000 | $501 | 0.84 | 1 | 57 |
| Total: 5 · Average | 2.0 | 1.6 | 1,053 | 5,007.2 | $471,360 | $471,360 | $453 | — | 40.6 | ||||
| Median | 1,088 | $460,000 | $460,000 | ||||||||||
Market Analysis
List vs Sale $/SqFt
Sale Price Trend
Days on Market
Sale vs List Price
This analysis was generated automatically from MLS data. For an in-depth, human-reviewed valuation, contact Joseph Sardella at josephsardella@gmail.com.