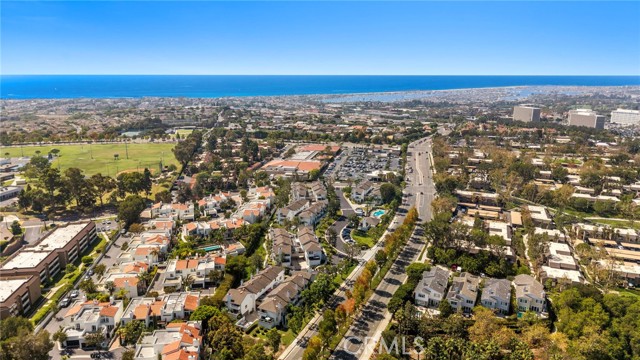
503 Harbor Woods Place, Newport Beach, CA 92660
503 Harbor Woods Place, Newport Beach, CA 92660
Property Description
Location, Location in the heart of Newport !! *** Spectacular greenbelt view with Fully Remodeled Kitchen with Upgraded Cabinetry, Solid Quartz Countertops with Full Backsplash and sit up island with waterfall feature, Newer Sink, Newer Dishwasher, Upgraded Viking cooktop and oven, premium venting system, soft close hinges and drawers *** Elegant engineered wood flooring throughout with LED recessed lighting, romantic fireplace and upgraded vinyl windows *** Highly upgraded bathroom with floor to ceiling custom tile and new sink *** Direct access garage with New Epoxy flooring and EV Charging *** Three private balconies as well !!
Features & Amenities
Property Details
Mortgage Calculator
Current Rates
Comparative Market Analysis
Affordable Tier · 5 active · 5 closed
Newport Beach · Condominium
Listed 8.5% below the median closed sale of $1,005,000.
Price Position
Priced below the market — value advantage over the field.
Active Properties (5)
Active Comparables
| Address | City | Year | BD | BTH | SqFt | LotSz | LP/SqFt | LP | DIM | Score |
|---|---|---|---|---|---|---|---|---|---|---|
| 107 Harbor Woods Place | Newport Beach | 1984 | 2 | 1 | 864 | 93,082 | $1,041 | $899,000 | 43 | 98 |
| 358 Villa Point Drive | Newport Beach | 1990 | 1 | 1 | 774 | 379,508 | $1,161 | $899,000 | 12 | 80 |
| 14 Villa Point | Newport Beach | 1992 | 1 | 1 | 774 | 390,415 | $1,163 | $900,000 | 40 | 77 |
| 38 Sea Island Drive | Newport Beach | 1977 | 2 | 2 | 1,197 | 10,000 | $848 | $1.01M | 93 | 70 |
| 55 Sea Island | Newport Beach | 1977 | 2 | 2 | 1,264 | 0 | $790 | $998,000 | 73 | 69 |
| Total: 5 · Average | 1.6 | 1.4 | 974.6 | 218,251.25 | $1,000.6 | $942,200 | 52.2 | |||
| Median | 864 | $900,000 | ||||||||
Closed Properties (5)
Closed Comparables
| Address | City | Year | Date | BD | BTH | SqFt | LotSz | LP | SP | SP/SqFt | SP/LP | DIM | Score |
|---|---|---|---|---|---|---|---|---|---|---|---|---|---|
| 110 Hartford Drive | Newport Beach | 1984 | 08/12/2026 | 2 | 1 | 839 | 0 | $1.05M | $1.00M | $1,198 | 0.96 | 83 | 81 |
| 358 Villa Point | Newport Beach | 1990 | 09/21/2026 | 1 | 1 | 792 | 379,508 | $810,000 | $805,000 | $1,016 | 0.99 | 158 | 80 |
| 232 Villa Point Drive | Newport Beach | 1990 | 05/20/2026 | 1 | 1 | 851 | 0 | $1.09M | $1.04M | $1,228 | 0.95 | 160 | 79 |
| 114 Corsica | Newport Beach | 1986 | 07/31/2026 | 2 | 2 | 920 | 59,648 | $1.02M | $1.01M | $1,097 | 0.98 | 45 | 72 |
| 1228 Rutland Rd | Newport Beach | 1961 | 06/30/2026 | 2 | 2 | 1,077 | 53,429 | $815,000 | $810,000 | $752 | 0.99 | 60 | 58 |
| Total: 5 · Average | 1.6 | 1.4 | 895.8 | 164,195 | $934,800 | $934,800 | $1,058.2 | — | 101.2 | ||||
| Median | 851 | $1.00M | $1.00M | ||||||||||
Market Analysis
List vs Sale $/SqFt
Sale Price Trend
Days on Market
Sale vs List Price
This analysis was generated automatically from MLS data. For an in-depth, human-reviewed valuation, contact Joseph Sardella at josephsardella@gmail.com.