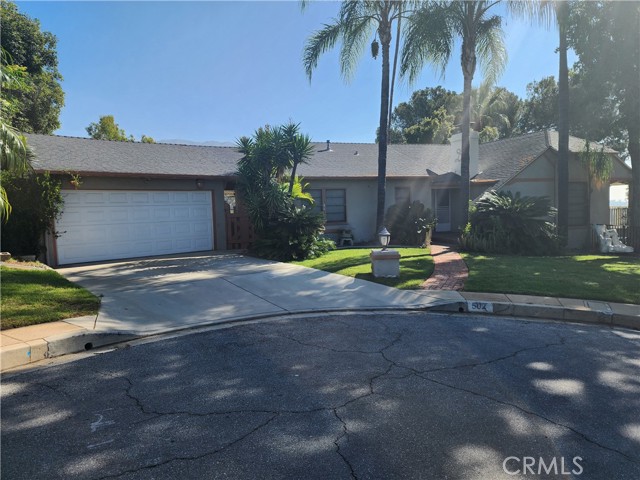
1 / 24
502 Mesa, Monrovia, CA 91016
$1.45M2bd · 2ba · 1,595 sqft
Lot 25,072 sqft•Single Family Residence•Active•35d on market•MLS# PW-26208422
502 Mesa, Monrovia, CA 91016
MLS# PW-26208422•Residential•Single Family Residence
Active35 days on market
$1,450,000
2
Beds
2
Baths
1,595
Sq Ft
25,072
Lot Sq Ft
1948
Year Built
City Lights
View
Property Description
SFR, located on small cul-de-sac, with views of the valley and city below. Property is in Receivership. Court Receiver is the selling Broker authorized to sell the property pursuant to court order. (Receiver is a California Licensed Real Estate Broker)
Features & Amenities
FeeBuilt 1948
Property Details
Land Type
Fee
Year Built
1948
Property Type
Residential
Property Subtype
Single Family Residence
Parking Spaces
2
Garage Spaces
2
Cooling
Central Air
View
City Lights
City
Monrovia
Zip Code
91016
County
Los Angeles
Mortgage Calculator
Current Rates
$
$
%
Monthly Payment
$7,331.99
Principal & Interest
Loan Amount
$1,160,000
Total Interest
$1,479,516
Total Payment Over 30 Years
$2,639,516
This calculator provides estimates only. Actual mortgage payments may include taxes, insurance, HOA fees, and PMI. Contact a lender for accurate quotes.
Comparative Market Analysis
Residential Tier · 5 active · 5 closed
502 Mesa, Monrovia, CA 91016
Monrovia · Single Family Residence
$1.45M
Residential TierBeds
2
Baths
2
Sqft
1,595
Lot
25,072 sqft
Year
1948
$/Sqft
$909
Pool: No✓
Spa: No✓
View: city✓
Garage: 2-car✓
Listed 13.3% above the median closed sale of $1,280,000. Price per sqft ($909) is a 21% premium to closed comps ($749).
Price Position
Positioned above the market — commands a premium.
Premium
Subject listed at $1.45M· $909/sqft
Total list price
Closed comps
vs closed median $1.28M
+$170K (+13.3%)
Active comps
vs active median $1.43M
+$25K (+1.8%)
Price per sqft
Closed compsinsufficient comp data
Active comps
vs active avg $/sqft $682
+$227 (+33.2%)
Active Properties (5)
Active Comparables
| Address | City | Year | BD | BTH | SqFt | LotSz | LP/SqFt | LP | DIM | Score |
|---|---|---|---|---|---|---|---|---|---|---|
| 452 Prospect Ave Avenue | Monrovia | 1978 | 3 | 2 | 1,925 | 7,620 | $726 | $1.40M | 16 | 76 |
| 442 Crestview Place | Monrovia | 1953 | 3 | 3 | 2,398 | 10,880 | $594 | $1.43M | 24 | 75 |
| 357 Oakcliff Road | Monrovia | 1957 | 4 | 3 | 1,820 | 7,267 | $769 | $1.40M | 38 | 68 |
| 16 Hidden Valley Road | Monrovia | 1974 | 3 | 3 | 2,795 | 23,068 | $572 | $1.60M | 26 | 66 |
| 346 Mountain Avenue | Monrovia | 1964 | 5 | 3 | 1,929 | 6,598 | $751 | $1.45M | 9 | 63 |
| Total: 5 · Average | 3.6 | 2.8 | 2,173.4 | 11,086.6 | $682.4 | $1.45M | 22.6 | |||
| Median | 1,929 | $1.43M | ||||||||
Closed Properties (5)
Closed Comparables
| Address | City | Year | Date | BD | BTH | SqFt | LotSz | LP | SP | SP/SqFt | SP/LP | DIM | Score |
|---|---|---|---|---|---|---|---|---|---|---|---|---|---|
| 609 Willowbrook | Monrovia | 1977 | 10/06/2026 | 3 | 3 | 2,459 | 17,801 | $1.81M | $1.65M | $669 | 0.91 | 112 | 75 |
| 328 N. Alta Vista Ave | Monrovia | 1949 | 06/11/2026 | 3 | 3 | 1,615 | 6,195 | $1.25M | $1.24M | $767 | 0.99 | 48 | 75 |
| 378 PATTERSON Drive | Monrovia | 1936 | 12/23/2025 | 3 | 2 | 1,700 | 6,250 | $1.20M | $1.28M | $753 | 1.07 | 36 | 73 |
| 254 Heather Heights Court | Monrovia | 1966 | 07/24/2026 | 4 | 2 | 1,753 | 7,380 | $1.28M | $1.25M | $713 | 0.98 | 59 | 73 |
| 333 Mayflower | Monrovia | 1921 | 08/27/2026 | 3 | 3 | 1,952 | 31,767 | $1.60M | $1.65M | $845 | 1.03 | 44 | 72 |
| Total: 5 · Average | 3.2 | 2.6 | 1,895.8 | 13,878.6 | $1.41M | $1.41M | $749.4 | — | 59.8 | ||||
| Median | 1,753 | $1.28M | $1.28M | ||||||||||
Market Analysis
List vs Sale $/SqFt
Sale Price Trend
Days on Market
Sale vs List Price
AI-generated CMA
This analysis was generated automatically from MLS data. For an in-depth, human-reviewed valuation, contact Joseph Sardella at josephsardella@gmail.com.