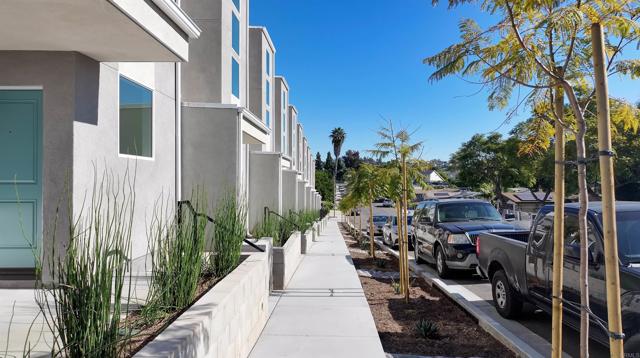
4958 Ocean View Boulevard, San Diego, CA 92113
4958 Ocean View Boulevard, San Diego, CA 92113
Property Description
This BRAND NEW detached PUD townhome offers a thoughtfully designed 3-bedroom, 3-bathroom layout with a two-car garage and modern finishes throughout. The home features ductless mini-split heating and cooling, energy-efficient systems, and paid solar, creating a comfortable and low-maintenance living space. The floor plan is functional and well-balanced, with bright interiors, contemporary lighting, and quality construction details. Designed for everyday living, the home provides both privacy and flexibility within a well-planned residential setting. This property is part of the City of San Diego Inclusionary Affordable Housing Program and is available to qualified buyers only. Income limits, resale restrictions, and owner-occupancy requirements apply. Buyer eligibility and program approval are required before purchase. Located near downtown San Diego with convenient access to freeways, shopping, dining, and local amenities, this is an opportunity to own new construction at an attainable price point.
Features & Amenities
Property Details
Mortgage Calculator
Current Rates
Comparative Market Analysis
Affordable Tier · 5 active · 5 closed
San Diego · Single Family Residence
Listed in line with the median closed sale of $571,000. Price per sqft ($391) is a 32% discount to closed comps ($579). Closed comps sold at 107% of list — strong seller's market.
Price Position
Aligned with the market — fair pricing for the comps.
Active Properties (5)
Active Comparables
| Address | City | Year | BD | BTH | SqFt | LotSz | LP/SqFt | LP | DIM | Score |
|---|---|---|---|---|---|---|---|---|---|---|
| 5282 Naranja Street | San Diego | 2025 | 3 | 3 | 1,423 | 900 | $379 | $539,000 | 92 | 92 |
| 5282 Naranja Street | San Diego | 2025 | 3 | 3 | 1,423 | 900 | $379 | $539,000 | 162 | 91 |
| 648 51 Street | San Diego | 1954 | 3 | 2 | 1,300 | 9,200 | $423 | $550,000 | 5 | 72 |
| 2930 E Plaza Blvd. | National City | 1997 | 3 | 2 | 1,193 | 5,700 | $436 | $520,000 | 10 | 67 |
| 821 Angelo Drive | National City | 1959 | 3 | 2 | 1,107 | 8,600 | $587 | $650,000 | 3 | 66 |
| Total: 5 · Average | 3.0 | 2.4 | 1,289.2 | 5,060 | $440.8 | $559,600 | 54.4 | |||
| Median | 1,300 | $539,000 | ||||||||
Closed Properties (5)
Closed Comparables
| Address | City | Year | Date | BD | BTH | SqFt | LotSz | LP | SP | SP/SqFt | SP/LP | DIM | Score |
|---|---|---|---|---|---|---|---|---|---|---|---|---|---|
| 1322 49th Street | San Diego | 1958 | 02/18/2026 | 3 | 2 | 1,050 | 5,300 | $480,000 | $571,000 | $544 | 1.19 | 22 | 68 |
| 5210 Roswell | San Diego | 1986 | 08/14/2026 | 3 | 2 | 946 | 5,301 | $399,999 | $501,500 | $530 | 1.25 | 9 | 68 |
| 5859 Skyline Drive | San Diego | 1956 | 01/16/2026 | 3 | 2 | 1,134 | 6,500 | $625,000 | $550,000 | $485 | 0.88 | 74 | 65 |
| 311 San Alberto Way | San Diego | 1952 | 10/22/2026 | 2 | 1 | 844 | 17,400 | $625,000 | $650,000 | $770 | 1.04 | 22 | 65 |
| 1012 45th Street | San Diego | 1986 | 12/10/2025 | 2 | 2 | 1,017 | 3,100 | $575,000 | $575,000 | $565 | 1.00 | 43 | 62 |
| Total: 5 · Average | 2.6 | 1.8 | 998.2 | 7,520.2 | $569,500 | $569,500 | $578.8 | — | 34 | ||||
| Median | 1,017 | $571,000 | $571,000 | ||||||||||
Market Analysis
List vs Sale $/SqFt
Sale Price Trend
Days on Market
Sale vs List Price
This analysis was generated automatically from MLS data. For an in-depth, human-reviewed valuation, contact Joseph Sardella at josephsardella@gmail.com.