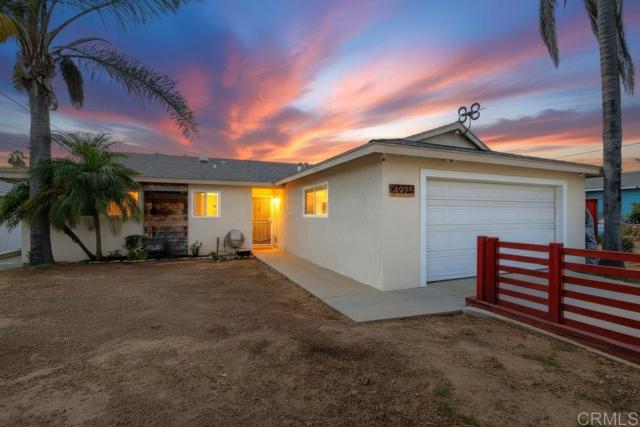
4925 Siesta Drive, Oceanside, CA 92057
4925 Siesta Drive, Oceanside, CA 92057
Property Description
3 bed, 2 full bath with 2-car garage. Spacious floor plan gives you both a living room and family room plus a cozy fireplace. Fully remodeled kitchen with plenty of cabinet space and newer appliances. Newer upgraded fixtures and dual-pane windows throughout. Both baths completely redone with designer tile, fixtures. lighting and wainscoting. Skylight and whole-house fan keep it bright and comfortable. Step outside to your private backyard and the star of the show—a just-renovated heated in-ground pool and spa. Move-in ready and fully upgraded. Libby Elementary 8/10 rating within walking distance from home.
Features & Amenities
Property Details
Mortgage Calculator
Current Rates
Comparative Market Analysis
Affordable Tier · 5 active · 5 closed
Oceanside · Single Family Residence
Listed 5.3% below the median closed sale of $781,000. Price per sqft ($495) is a 14% discount to closed comps ($573). Closed comps sold at 100% of list — strong seller's market.
Price Position
Priced below the market — value advantage over the field.
Active Properties (5)
Active Comparables
| Address | City | Year | BD | BTH | SqFt | LotSz | LP/SqFt | LP | DIM | Score |
|---|---|---|---|---|---|---|---|---|---|---|
| 178 Harrison Street | Oceanside | 1976 | 4 | 2 | 1,308 | 6,088 | $535 | $699,985 | 10 | 85 |
| 4753 Calle Estrella | Oceanside | 1972 | 3 | 2 | 1,245 | 4,000 | $545 | $679,000 | 20 | 84 |
| 630 Ann Street | Oceanside | 1970 | 3 | 2 | 1,074 | 6,200 | $745 | $799,900 | 15 | 83 |
| 4932 Verde Drive | Oceanside | 1964 | 3 | 2 | 988 | 7,300 | $697 | $689,000 | 39 | 83 |
| 652 Parker | Oceanside | 1968 | 4 | 2 | 1,192 | 6,900 | $654 | $779,000 | 24 | 80 |
| Total: 5 · Average | 3.4 | 2.0 | 1,161.4 | 6,097.6 | $635.2 | $729,377 | 21.6 | |||
| Median | 1,192 | $699,985 | ||||||||
Closed Properties (5)
Closed Comparables
| Address | City | Year | Date | BD | BTH | SqFt | LotSz | LP | SP | SP/SqFt | SP/LP | DIM | Score |
|---|---|---|---|---|---|---|---|---|---|---|---|---|---|
| 4949 Luna Drive | Oceanside | 1965 | 02/13/2026 | 3 | 2 | 1,494 | 6,000 | $829,000 | $825,000 | $552 | 0.99 | 51 | 89 |
| 4919 Roja Drive | Oceanside | 1964 | 05/12/2026 | 3 | 2 | 1,196 | 6,000 | $749,900 | $760,000 | $635 | 1.01 | 32 | 88 |
| 4947 Luna Drive | Oceanside | 1964 | 12/22/2025 | 3 | 2 | 1,310 | 6,100 | $845,000 | $845,000 | $645 | 1.00 | 28 | 86 |
| 534 Luna | Oceanside | 1966 | 11/11/2025 | 3 | 2 | 1,710 | 8,300 | $649,995 | $649,995 | $380 | 1.00 | 26 | 83 |
| 4827 Luna Drive | Oceanside | 1964 | 11/21/2025 | 3 | 2 | 1,196 | 7,405 | $779,999 | $781,000 | $653 | 1.00 | 36 | 82 |
| Total: 5 · Average | 3.0 | 2.0 | 1,381.2 | 6,761 | $772,199 | $772,199 | $573 | — | 34.6 | ||||
| Median | 1,310 | $781,000 | $781,000 | ||||||||||
Market Analysis
List vs Sale $/SqFt
Sale Price Trend
Days on Market
Sale vs List Price
This analysis was generated automatically from MLS data. For an in-depth, human-reviewed valuation, contact Joseph Sardella at josephsardella@gmail.com.