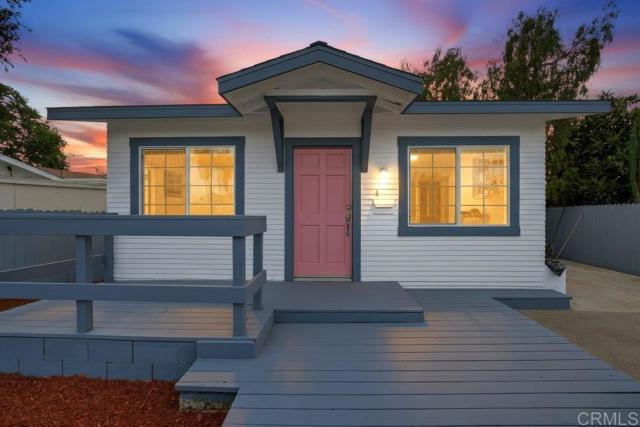
4845 Wightman Street, San Diego, CA 92105
4845 Wightman Street, San Diego, CA 92105
Property Description
This cozy home features hardwood floors, a walk-in closet, canyon views and fresh paint inside and out. It is near shops and public transportation. The back yard has great potential! Lots of space to build a deck and/or to start a fruit, vegetable or herb garden. A-I-generated conceptual image for illustrative purposes only. Improvements shown do not currently exist and are subject to buyer investigation, design review, permits, and approvals.
Features & Amenities
Property Details
Mortgage Calculator
Current Rates
Comparative Market Analysis
Affordable Tier · 5 active · 5 closed
San Diego · Single Family Residence
Listed 4.7% above the median closed sale of $620,000. Price per sqft ($1,135) is a 32% premium to closed comps ($860). Closed comps sold at 101% of list — strong seller's market.
Price Position
Aligned with the market — fair pricing for the comps.
Active Properties (5)
Active Comparables
| Address | City | Year | BD | BTH | SqFt | LotSz | LP/SqFt | LP | DIM | Score |
|---|---|---|---|---|---|---|---|---|---|---|
| 4421 49Th Street | San Diego | 1954 | 2 | 1 | 533 | 1,307 | $1,191 | $635,000 | 9 | 81 |
| 3990 Broadway | San Diego | 1929 | 2 | 1 | 822 | 3,851 | $700 | $575,000 | 1 | 69 |
| 4202 43rd Street | San Diego | 1926 | 3 | 1 | 1,327 | 4,144 | $520 | $689,900 | 9 | 63 |
| 928 42nd Street | San Diego | 1952 | 3 | 1 | 868 | 2,700 | $795 | $690,000 | 12 | 57 |
| 3139 Winlow Street | San Diego | 1949 | 3 | 2 | 1,386 | 5,100 | $490 | $679,800 | 23 | 57 |
| Total: 5 · Average | 2.6 | 1.2 | 987.2 | 3,420.4 | $739.2 | $653,940 | 10.8 | |||
| Median | 868 | $679,800 | ||||||||
Closed Properties (5)
Closed Comparables
| Address | City | Year | Date | BD | BTH | SqFt | LotSz | LP | SP | SP/SqFt | SP/LP | DIM | Score |
|---|---|---|---|---|---|---|---|---|---|---|---|---|---|
| 4575 Dwight Street | San Diego | 1937 | 09/30/2026 | 2 | 1 | 780 | 1,777 | $570,000 | $570,000 | $731 | 1.00 | 68 | 80 |
| 3711 46Th Street | San Diego | 1940 | 08/06/2026 | 1 | 1 | 400 | 2,178 | $545,000 | $560,000 | $1,400 | 1.03 | 37 | 78 |
| 3578 CHAMOUNE Avenue | San Diego | 1928 | 04/03/2026 | 2 | 1 | 850 | 5,861 | $690,000 | $690,000 | $812 | 1.00 | 176 | 78 |
| 3255 Menlo | San Diego | 1959 | 06/24/2026 | 2 | 1 | 783 | 3,367 | $595,000 | $620,000 | $792 | 1.04 | 50 | 75 |
| 4092 Winona Avenue | San Diego | 1948 | 10/28/2026 | 3 | 2 | 1,275 | 3,751 | $719,000 | $720,000 | $565 | 1.00 | 27 | 60 |
| Total: 5 · Average | 2.0 | 1.2 | 817.6 | 3,386.8 | $632,000 | $632,000 | $860 | — | 71.6 | ||||
| Median | 783 | $620,000 | $620,000 | ||||||||||
Market Analysis
List vs Sale $/SqFt
Sale Price Trend
Days on Market
Sale vs List Price
This analysis was generated automatically from MLS data. For an in-depth, human-reviewed valuation, contact Joseph Sardella at josephsardella@gmail.com.