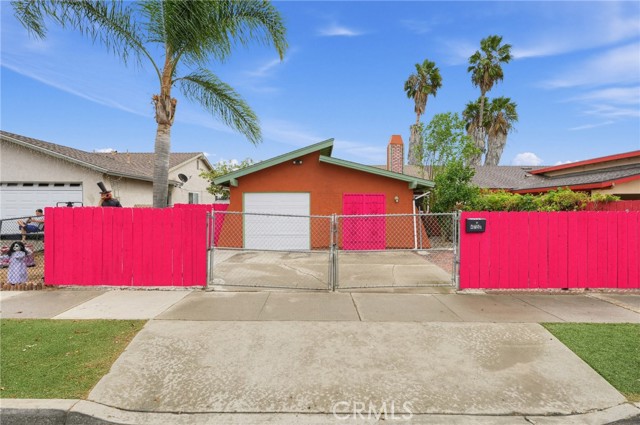
4753 Calle Estrella, Oceanside, CA 92057
4753 Calle Estrella, Oceanside, CA 92057
Property Description
This is a beautifully renovated home with well over 100k in upgrades. Some upgrades include remodeled bathrooms, dual pane windows, new water heater, automatic drip system for plants and trees, newer stucco, paid-off solar system (included in asking price), newly painted walls (inside and out), freshly painted fence, an additional permitted room built to add space to the home, and much more. This home provides an excellent value for the price considering the size, location, condition, and extras. Best of all, no HOA! It's time to treat yourself to a well maintained and cared for property; Not some headache that needs extensive and costly repairs or a home that feels like you're living in the 70s or 80s. At $545 per square foot, you are looking at the deal!
Features & Amenities
Property Details
Mortgage Calculator
Current Rates
About Oceanside
This property is located in Oceanside, a community in Oceanside. Explore more listings in this neighborhood to compare options and pricing.
View Oceanside ListingsComparative Market Analysis
Affordable Tier · 5 active · 5 closed
Oceanside · Oceanside · Single Family Residence
Listed 6.2% below the median closed sale of $724,000. Price per sqft ($545) is a 16% discount to closed comps ($645). Closed comps sold at 101% of list — strong seller's market.
Price Position
Priced below the market — value advantage over the field.
Active Properties (5)
Active Comparables
| Address | City | Year | BD | BTH | SqFt | LotSz | LP/SqFt | LP | DIM | Score |
|---|---|---|---|---|---|---|---|---|---|---|
| 4609 Calle Del Palo | Oceanside | 1979 | 3 | 1 | 827 | 3,600 | $724 | $599,000 | 9 | 82 |
| 355 Calle Mariposa | Oceanside | 1972 | 3 | 2 | 1,055 | 3,400 | $592 | $625,000 | 77 | 82 |
| 4932 Verde Drive | Oceanside | 1964 | 3 | 2 | 988 | 7,300 | $697 | $689,000 | 39 | 74 |
| 4925 Siesta Drive | Oceanside | 1964 | 3 | 2 | 1,496 | 6,098 | $495 | $739,900 | 45 | 73 |
| 178 Harrison Street | Oceanside | 1976 | 4 | 2 | 1,308 | 6,088 | $535 | $699,985 | 10 | 73 |
| Total: 5 · Average | 3.2 | 1.8 | 1,134.8 | 5,297.2 | $608.6 | $670,577 | 36 | |||
| Median | 1,055 | $689,000 | ||||||||
Closed Properties (5)
Closed Comparables
| Address | City | Year | Date | BD | BTH | SqFt | LotSz | LP | SP | SP/SqFt | SP/LP | DIM | Score |
|---|---|---|---|---|---|---|---|---|---|---|---|---|---|
| 4626 Calle De Retiro | Oceanside | 1980 | 10/16/2026 | 4 | 2 | 1,450 | 3,303 | $724,000 | $724,000 | $499 | 1.00 | 78 | 88 |
| 309 Calle Montecito | Oceanside | 1972 | 10/13/2026 | 2 | 1 | 902 | 3,973 | $579,999 | $585,000 | $649 | 1.01 | 95 | 86 |
| 395 Calle Mariposa | Oceanside | 1972 | 08/14/2026 | 2 | 1 | 902 | 3,400 | $595,000 | $603,000 | $669 | 1.01 | 58 | 82 |
| 4919 Roja Drive | Oceanside | 1964 | 05/12/2026 | 3 | 2 | 1,196 | 6,000 | $749,900 | $760,000 | $635 | 1.01 | 32 | 75 |
| 4824 Siesta Drive | Oceanside | 1964 | 01/29/2026 | 3 | 2 | 988 | 6,100 | $765,000 | $764,000 | $773 | 1.00 | 48 | 73 |
| Total: 5 · Average | 2.8 | 1.6 | 1,087.6 | 4,555.2 | $687,200 | $687,200 | $645 | — | 62.2 | ||||
| Median | 988 | $724,000 | $724,000 | ||||||||||
Market Analysis
List vs Sale $/SqFt
Sale Price Trend
Days on Market
Sale vs List Price
This analysis was generated automatically from MLS data. For an in-depth, human-reviewed valuation, contact Joseph Sardella at josephsardella@gmail.com.