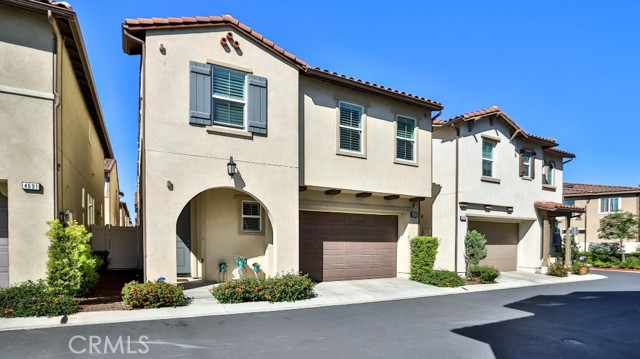
1 / 1
4693 Holly, Long Beach, CA 90805
$950K3bd · 3ba · 2,083 sqft
Lot 2,410 sqft•HOA $245/mo•Single Family Residence•Active•33d on market•MLS# DW-26213312
4693 Holly, Long Beach, CA 90805
MLS# DW-26213312•Residential•Single Family Residence
Active33 days on market
$949,999
3
Beds
3
Baths
2,083
Sq Ft
2,410
Lot Sq Ft
$245
HOA/mo
2018
Year Built
See Remarks
View
Features & Amenities
Property Details
Subdivision
North Long Beach
Land Type
Fee
Year Built
2018
Property Type
Residential
Property Subtype
Single Family Residence
Parking Spaces
2
Garage Spaces
2
Heating
Central
Cooling
Central Air
View
See Remarks
City
Long Beach
Zip Code
90805
County
Los Angeles
Mortgage Calculator
Current Rates
$
$
%
Monthly Payment
$4,803.71
Principal & Interest
Loan Amount
$759,999
Total Interest
$969,337
Total Payment Over 30 Years
$1,729,336
This calculator provides estimates only. Actual mortgage payments may include taxes, insurance, HOA fees, and PMI. Contact a lender for accurate quotes.
About North Long Beach
This property is located in North Long Beach, a community in Long Beach. Explore more listings in this neighborhood to compare options and pricing.
View North Long Beach ListingsComparative Market Analysis
Residential Tier · 5 active · 5 closed
4693 Holly, Long Beach, CA 90805
North Long Beach · Long Beach · Single Family Residence
$950K
Residential TierBeds
3
Baths
3
Sqft
2,083
Lot
2,410 sqft
Year
2018
$/Sqft
$456
Pool: No✓
View: See Remarks✓
Garage: 2-car✓
Listed in line with the median closed sale of $949,000. Price per sqft ($456) is a 18% discount to closed comps ($558).
Price Position
Aligned with the market — fair pricing for the comps.
At market
Subject listed at $950K· $456/sqft
Total list price
Closed comps
vs closed median $949K
+$999 (+0.1%)
Active comps
vs active median $899K
+$51K (+5.7%)
Price per sqft
Closed compsinsufficient comp data
Active comps
vs active avg $/sqft $553
−$97 (−17.5%)
Active Properties (5)
Active Comparables
| Address | City | Year | BD | BTH | SqFt | LotSz | LP/SqFt | LP | DIM | Score |
|---|---|---|---|---|---|---|---|---|---|---|
| 152 Ridgewood | Long Beach | 2018 | 3 | 3 | 2,000 | 2,430 | $475 | $950,000 | 4 | 98 |
| 250 Ridgewood | Long Beach | 2018 | 5 | 3 | 2,252 | 2,937 | $466 | $1.05M | 39 | 92 |
| 5447 Lime Avenue | Long Beach | 1927 | 3 | 2 | 1,570 | 5,301 | $573 | $899,000 | 117 | 67 |
| 808 33rd | Long Beach | 1944 | 3 | 1 | 990 | 6,356 | $879 | $869,880 | 45 | 61 |
| 2542 Madison Street | Carson | 2009 | 4 | 2 | 2,416 | 5,662 | $372 | $899,000 | 43 | 59 |
| Total: 5 · Average | 3.6 | 2.2 | 1,845.6 | 4,537.2 | $553 | $933,575.8 | 49.6 | |||
| Median | 2,000 | $899,000 | ||||||||
Closed Properties (5)
Closed Comparables
| Address | City | Year | Date | BD | BTH | SqFt | LotSz | LP | SP | SP/SqFt | SP/LP | DIM | Score |
|---|---|---|---|---|---|---|---|---|---|---|---|---|---|
| 4750 Holly Avenue | Long Beach | 2018 | 06/19/2026 | 4 | 3 | 2,083 | 2,666 | $1.13M | $1.05M | $504 | 0.93 | 113 | 95 |
| 4023 Marion | Long Beach | 1974 | 06/12/2026 | 2 | 3 | 2,046 | 4,604 | $850,000 | $840,000 | $411 | 0.99 | 4 | 64 |
| 354 Carson | Long Beach | 1925 | 08/28/2026 | 4 | 2 | 2,066 | 7,000 | $839,990 | $810,000 | $392 | 0.96 | 78 | 61 |
| 4392 Elm | Long Beach | 1944 | 06/25/2026 | 3 | 2 | 1,372 | 6,398 | $1.00M | $1.00M | $729 | 1.00 | 64 | 58 |
| 4496 Linden | Long Beach | 1944 | 07/09/2026 | 3 | 2 | 1,260 | 6,896 | $949,000 | $949,000 | $753 | 1.00 | 45 | 56 |
| Total: 5 · Average | 3.2 | 2.4 | 1,765.4 | 5,512.8 | $929,800 | $929,800 | $557.8 | — | 60.8 | ||||
| Median | 2,046 | $949,000 | $949,000 | ||||||||||
Market Analysis
List vs Sale $/SqFt
Sale Price Trend
Days on Market
Sale vs List Price
AI-generated CMA
This analysis was generated automatically from MLS data. For an in-depth, human-reviewed valuation, contact Joseph Sardella at josephsardella@gmail.com.