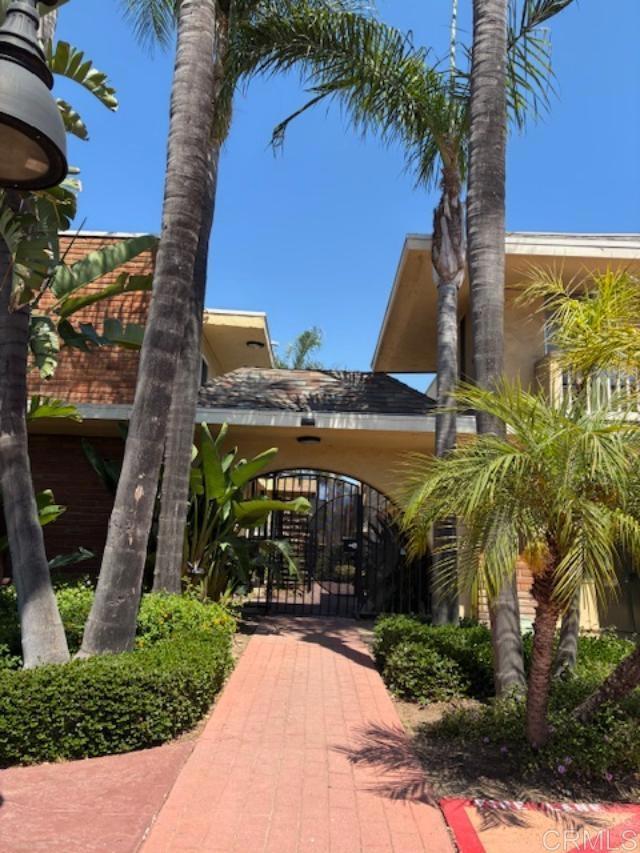
467 Ballantyne St, 47, El Cajon, CA 92020
467 Ballantyne St, 47, El Cajon, CA 92020
Property Description
Short Sale and VA Approved condo, TOP floor, end unit overlooks the pool. Completely remodeled with newer windows, and tasteful upgrades. Private location, there are only two units that are located up stairs in this location offering privacy and lovely views of the palm trees and the pool. Quiet location. Amenities include, Covered assigned parking, superb landscaping, work out room, pool and hot tub. Laundry facilities and a Gated community. Convenient location with easy access to the 8 freeway. Walking distance to Main Street in El Cajon shopping and dining.
Features & Amenities
Property Details
Mortgage Calculator
Current Rates
Comparative Market Analysis
Affordable Tier · 5 active · 5 closed
El Cajon · Condominium
Listed in line with the median closed sale of $299,000. Price per sqft ($413) is a 18% discount to closed comps ($504). Closed comps sold at 102% of list — strong seller's market.
Price Position
Aligned with the market — fair pricing for the comps.
Active Properties (5)
Active Comparables
| Address | City | Year | BD | BTH | SqFt | LotSz | LP/SqFt | LP | DIM | Score |
|---|---|---|---|---|---|---|---|---|---|---|
| 930 Peach Avenue | El Cajon | 1990 | 1 | 1 | 625 | 37,724 | $496 | $310,000 | 10 | 90 |
| 1045 Peach Avenue | El Cajon | 1985 | 1 | 1 | 721 | 106,286 | $415 | $299,000 | 109 | 90 |
| 540 Oakdale Lane | El Cajon | 1965 | 1 | 1 | 704 | 218,671 | $389 | $274,000 | 38 | 83 |
| 800 Mollison | El Cajon | 1995 | 1 | 1 | 460 | 0 | $598 | $275,000 | 100 | 82 |
| 800 Mollison Avenue | El Cajon | 1995 | 1 | 1 | 460 | 0 | $641 | $295,000 | 177 | 78 |
| Total: 5 · Average | 1.0 | 1.0 | 594 | 120,893.667 | $507.8 | $290,600 | 86.8 | |||
| Median | 625 | $295,000 | ||||||||
Closed Properties (5)
Closed Comparables
| Address | City | Year | Date | BD | BTH | SqFt | LotSz | LP | SP | SP/SqFt | SP/LP | DIM | Score |
|---|---|---|---|---|---|---|---|---|---|---|---|---|---|
| 559 Madison Avenue | El Cajon | 1987 | 08/20/2026 | 1 | 1 | 710 | 163,211 | $299,000 | $299,000 | $421 | 1.00 | 50 | 97 |
| 930 Peach Avenue | El Cajon | 1990 | 09/23/2026 | 1 | 1 | 625 | 0 | $275,000 | $285,000 | $456 | 1.04 | 186 | 88 |
| 800 Mollison Avenue | El Cajon | 1995 | 10/28/2026 | 1 | 1 | 460 | 0 | $299,000 | $299,000 | $650 | 1.00 | 70 | 84 |
| 540 Oakdale Lane | El Cajon | 1965 | 08/03/2026 | 1 | 1 | 704 | 0 | $299,000 | $305,000 | $433 | 1.02 | 87 | 82 |
| 1423 Graves Avenue | El Cajon | 1995 | 12/05/2025 | 1 | 1 | 597 | 451,359 | $325,000 | $335,000 | $561 | 1.03 | 122 | 78 |
| Total: 5 · Average | 1.0 | 1.0 | 619.2 | 307,285 | $304,600 | $304,600 | $504.2 | — | 103 | ||||
| Median | 625 | $299,000 | $299,000 | ||||||||||
Market Analysis
List vs Sale $/SqFt
Sale Price Trend
Days on Market
Sale vs List Price
This analysis was generated automatically from MLS data. For an in-depth, human-reviewed valuation, contact Joseph Sardella at josephsardella@gmail.com.